A short look into providers objects#
One of the benefits of contextily is that it interfaces with the popular XYZ tiling standard. This means that any tiles provided through this format can be accessed. To make your life easier, contextily comes with a set of providers included in `xyzservices <https://xyzservices.readthedocs.io/en/stable/index.html>`__ that makes including their maps much more straightforward and does not require you know any of the pesky details of the interface. These are all accessible in the
contextily.providers submodule. The specification contextily uses to store these is defined in xyzservices so you can mimic it with an alternative provider that may not be built-in. This notebook will take a look at the providers, illustrating how it works, what’s available and how you can expand it if needed.
[1]:
import contextily as cx
import xyzservices.providers as xyz

import matplotlib.pyplot as plt
Choosing a web tile provider#
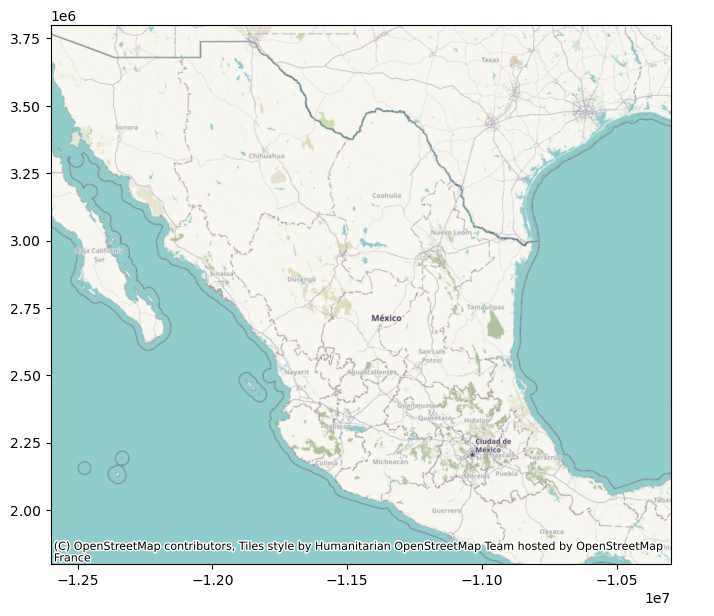
By default, if the user does not specify anything in this respect, the OpenStreetMap Humanitarian background is used:
[2]:
# we are using an extent around Mexico for the examples
extent = (-12600000, -10300000, 1800000, 3800000)
[3]:
fig, ax = plt.subplots(figsize=(8, 8))
ax.axis(extent)
cx.add_basemap(ax)
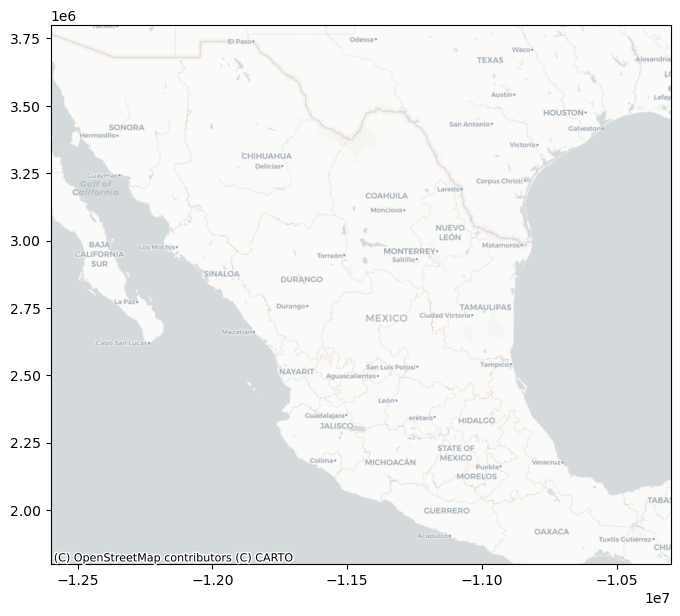
The default can be modified by specifying a different provider with the source keyword.
For example, to use Carto’s Positron theme:
[4]:
fig, ax = plt.subplots(figsize=(8, 8))
ax.axis(extent)
cx.add_basemap(ax, source=cx.providers.CartoDB.Positron)
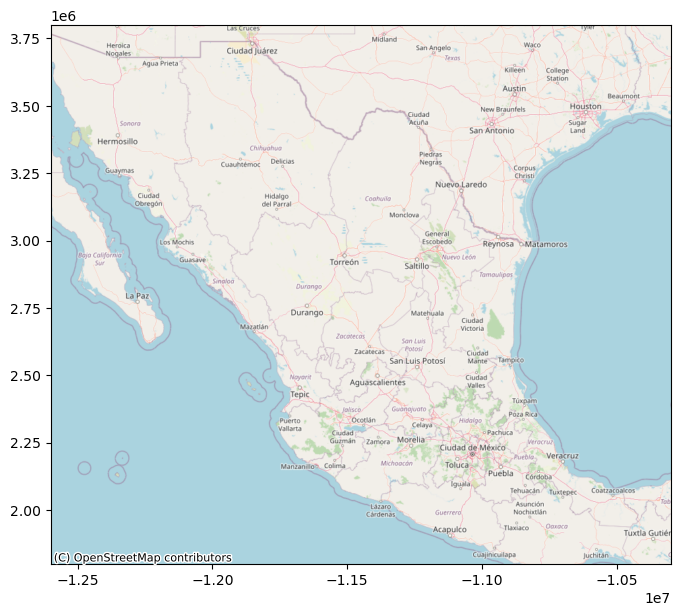
Or the main theme by OpenStreetMap:
[5]:
fig, ax = plt.subplots(figsize=(8, 8))
ax.axis(extent)
cx.add_basemap(ax, source=cx.providers.OpenStreetMap.Mapnik)

Passing source=cx.providers.OpenStreetMap.Mapnik is exactly the same as using xyzservices directly - source=xyz.OpenStreetMap.Mapnik. Under the hood, contextily.providers just wraps xyzservices.providers.
[6]:
fig, ax = plt.subplots(figsize=(8, 8))
ax.axis(extent)
cx.add_basemap(ax, source=xyz.OpenStreetMap.Mapnik)
What is this “provider” object ?#
The provider objects being passed to add_basemap are stored as xyzservices.TileProvider objects (enhanced dictionaries with attribute access for easy access), so we can explore them in Python (or using tab completion in an interactive session!):
[7]:
cx.providers
[7]:
-
xyzservices.Bunch7 items
-
xyzservices.TileProviderOpenStreetMap.Mapnik
- url
- https://tile.openstreetmap.org/{z}/{x}/{y}.png
- max_zoom
- 19
- html_attribution
- © OpenStreetMap contributors
- attribution
- (C) OpenStreetMap contributors
-
xyzservices.TileProviderOpenStreetMap.DE
- url
- https://tile.openstreetmap.de/{z}/{x}/{y}.png
- max_zoom
- 18
- html_attribution
- © OpenStreetMap contributors
- attribution
- (C) OpenStreetMap contributors
-
xyzservices.TileProviderOpenStreetMap.CH
- url
- https://tile.osm.ch/switzerland/{z}/{x}/{y}.png
- max_zoom
- 18
- html_attribution
- © OpenStreetMap contributors
- attribution
- (C) OpenStreetMap contributors
- bounds
- [[45, 5], [48, 11]]
-
xyzservices.TileProviderOpenStreetMap.France
- url
- https://{s}.tile.openstreetmap.fr/osmfr/{z}/{x}/{y}.png
- max_zoom
- 20
- html_attribution
- © OpenStreetMap France | © OpenStreetMap contributors
- attribution
- (C) OpenStreetMap France | (C) OpenStreetMap contributors
-
xyzservices.TileProviderOpenStreetMap.HOT
- url
- https://{s}.tile.openstreetmap.fr/hot/{z}/{x}/{y}.png
- max_zoom
- 19
- html_attribution
- © OpenStreetMap contributors, Tiles style by Humanitarian OpenStreetMap Team hosted by OpenStreetMap France
- attribution
- (C) OpenStreetMap contributors, Tiles style by Humanitarian OpenStreetMap Team hosted by OpenStreetMap France
-
xyzservices.TileProviderOpenStreetMap.BZH
- url
- https://tile.openstreetmap.bzh/br/{z}/{x}/{y}.png
- max_zoom
- 19
- html_attribution
- © OpenStreetMap contributors, Tiles courtesy of Breton OpenStreetMap Team
- attribution
- (C) OpenStreetMap contributors, Tiles courtesy of Breton OpenStreetMap Team
- bounds
- [[46.2, -5.5], [50, 0.7]]
-
xyzservices.TileProviderOpenStreetMap.BlackAndWhite
- url
- http://{s}.tiles.wmflabs.org/bw-mapnik/{z}/{x}/{y}.png
- max_zoom
- 18
- attribution
- (C) OpenStreetMap contributors
- html_attribution
- © OpenStreetMap contributors
-
-
xyzservices.Bunch3 items
-
xyzservices.TileProviderMapTilesAPI.OSMEnglish
- url
- https://maptiles.p.rapidapi.com/{variant}/{z}/{x}/{y}.png?rapidapi-key={apikey}
- html_attribution
- © MapTiles API, © OpenStreetMap contributors
- attribution
- (C) MapTiles API, (C) OpenStreetMap contributors
- variant
- en/map/v1
- apikey
- max_zoom
- 19
-
xyzservices.TileProviderMapTilesAPI.OSMFrancais
- url
- https://maptiles.p.rapidapi.com/{variant}/{z}/{x}/{y}.png?rapidapi-key={apikey}
- html_attribution
- © MapTiles API, © OpenStreetMap contributors
- attribution
- (C) MapTiles API, (C) OpenStreetMap contributors
- variant
- fr/map/v1
- apikey
- max_zoom
- 19
-
xyzservices.TileProviderMapTilesAPI.OSMEspagnol
- url
- https://maptiles.p.rapidapi.com/{variant}/{z}/{x}/{y}.png?rapidapi-key={apikey}
- html_attribution
- © MapTiles API, © OpenStreetMap contributors
- attribution
- (C) MapTiles API, (C) OpenStreetMap contributors
- variant
- es/map/v1
- apikey
- max_zoom
- 19
-
-
xyzservices.TileProviderOpenSeaMap
- url
- https://tiles.openseamap.org/seamark/{z}/{x}/{y}.png
- html_attribution
- Map data: © OpenSeaMap contributors
- attribution
- Map data: (C) OpenSeaMap contributors
-
xyzservices.TileProviderOPNVKarte
- url
- https://tileserver.memomaps.de/tilegen/{z}/{x}/{y}.png
- max_zoom
- 18
- html_attribution
- Map memomaps.de CC-BY-SA, map data © OpenStreetMap contributors
- attribution
- Map memomaps.de CC-BY-SA, map data (C) OpenStreetMap contributors
-
xyzservices.TileProviderOpenTopoMap
- url
- https://{s}.tile.opentopomap.org/{z}/{x}/{y}.png
- max_zoom
- 17
- html_attribution
- Map data: © OpenStreetMap contributors, SRTM | Map style: © OpenTopoMap (CC-BY-SA)
- attribution
- Map data: (C) OpenStreetMap contributors, SRTM | Map style: (C) OpenTopoMap (CC-BY-SA)
-
xyzservices.TileProviderOpenRailwayMap
- url
- https://{s}.tiles.openrailwaymap.org/standard/{z}/{x}/{y}.png
- max_zoom
- 19
- html_attribution
- Map data: © OpenStreetMap contributors | Map style: © OpenRailwayMap (CC-BY-SA)
- attribution
- Map data: (C) OpenStreetMap contributors | Map style: (C) OpenRailwayMap (CC-BY-SA)
-
xyzservices.TileProviderOpenFireMap
- url
- http://openfiremap.org/hytiles/{z}/{x}/{y}.png
- max_zoom
- 19
- html_attribution
- Map data: © OpenStreetMap contributors | Map style: © OpenFireMap (CC-BY-SA)
- attribution
- Map data: (C) OpenStreetMap contributors | Map style: (C) OpenFireMap (CC-BY-SA)
-
xyzservices.TileProviderSafeCast
- url
- https://s3.amazonaws.com/te512.safecast.org/{z}/{x}/{y}.png
- max_zoom
- 16
- html_attribution
- Map data: © OpenStreetMap contributors | Map style: © SafeCast (CC-BY-SA)
- attribution
- Map data: (C) OpenStreetMap contributors | Map style: (C) SafeCast (CC-BY-SA)
-
xyzservices.Bunch14 items
-
xyzservices.TileProviderStadia.AlidadeSmooth
- url
- https://tiles.stadiamaps.com/tiles/{variant}/{z}/{x}/{y}{r}.{ext}
- min_zoom
- 0
- max_zoom
- 20
- html_attribution
- © Stadia Maps © OpenMapTiles © OpenStreetMap contributors
- attribution
- (C) Stadia Maps (C) OpenMapTiles (C) OpenStreetMap contributors
- variant
- alidade_smooth
- ext
- png
-
xyzservices.TileProviderStadia.AlidadeSmoothDark
- url
- https://tiles.stadiamaps.com/tiles/{variant}/{z}/{x}/{y}{r}.{ext}
- min_zoom
- 0
- max_zoom
- 20
- html_attribution
- © Stadia Maps © OpenMapTiles © OpenStreetMap contributors
- attribution
- (C) Stadia Maps (C) OpenMapTiles (C) OpenStreetMap contributors
- variant
- alidade_smooth_dark
- ext
- png
-
xyzservices.TileProviderStadia.OSMBright
- url
- https://tiles.stadiamaps.com/tiles/{variant}/{z}/{x}/{y}{r}.{ext}
- min_zoom
- 0
- max_zoom
- 20
- html_attribution
- © Stadia Maps © OpenMapTiles © OpenStreetMap contributors
- attribution
- (C) Stadia Maps (C) OpenMapTiles (C) OpenStreetMap contributors
- variant
- osm_bright
- ext
- png
-
xyzservices.TileProviderStadia.Outdoors
- url
- https://tiles.stadiamaps.com/tiles/{variant}/{z}/{x}/{y}{r}.{ext}
- min_zoom
- 0
- max_zoom
- 20
- html_attribution
- © Stadia Maps © OpenMapTiles © OpenStreetMap contributors
- attribution
- (C) Stadia Maps (C) OpenMapTiles (C) OpenStreetMap contributors
- variant
- outdoors
- ext
- png
-
xyzservices.TileProviderStadia.StamenToner
- url
- https://tiles.stadiamaps.com/tiles/{variant}/{z}/{x}/{y}{r}.{ext}
- min_zoom
- 0
- max_zoom
- 20
- html_attribution
- © Stadia Maps © Stamen Design © OpenMapTiles © OpenStreetMap contributors
- attribution
- (C) Stadia Maps (C) Stamen Design (C) OpenMapTiles (C) OpenStreetMap contributors
- variant
- stamen_toner
- ext
- png
-
xyzservices.TileProviderStadia.StamenTonerBackground
- url
- https://tiles.stadiamaps.com/tiles/{variant}/{z}/{x}/{y}{r}.{ext}
- min_zoom
- 0
- max_zoom
- 20
- html_attribution
- © Stadia Maps © Stamen Design © OpenMapTiles © OpenStreetMap contributors
- attribution
- (C) Stadia Maps (C) Stamen Design (C) OpenMapTiles (C) OpenStreetMap contributors
- variant
- stamen_toner_background
- ext
- png
-
xyzservices.TileProviderStadia.StamenTonerLines
- url
- https://tiles.stadiamaps.com/tiles/{variant}/{z}/{x}/{y}{r}.{ext}
- min_zoom
- 0
- max_zoom
- 20
- html_attribution
- © Stadia Maps © Stamen Design © OpenMapTiles © OpenStreetMap contributors
- attribution
- (C) Stadia Maps (C) Stamen Design (C) OpenMapTiles (C) OpenStreetMap contributors
- variant
- stamen_toner_lines
- ext
- png
-
xyzservices.TileProviderStadia.StamenTonerLabels
- url
- https://tiles.stadiamaps.com/tiles/{variant}/{z}/{x}/{y}{r}.{ext}
- min_zoom
- 0
- max_zoom
- 20
- html_attribution
- © Stadia Maps © Stamen Design © OpenMapTiles © OpenStreetMap contributors
- attribution
- (C) Stadia Maps (C) Stamen Design (C) OpenMapTiles (C) OpenStreetMap contributors
- variant
- stamen_toner_labels
- ext
- png
-
xyzservices.TileProviderStadia.StamenTonerLite
- url
- https://tiles.stadiamaps.com/tiles/{variant}/{z}/{x}/{y}{r}.{ext}
- min_zoom
- 0
- max_zoom
- 20
- html_attribution
- © Stadia Maps © Stamen Design © OpenMapTiles © OpenStreetMap contributors
- attribution
- (C) Stadia Maps (C) Stamen Design (C) OpenMapTiles (C) OpenStreetMap contributors
- variant
- stamen_toner_lite
- ext
- png
-
xyzservices.TileProviderStadia.StamenWatercolor
- url
- https://tiles.stadiamaps.com/tiles/{variant}/{z}/{x}/{y}.{ext}
- min_zoom
- 1
- max_zoom
- 16
- html_attribution
- © Stadia Maps © Stamen Design © OpenMapTiles © OpenStreetMap contributors
- attribution
- (C) Stadia Maps (C) Stamen Design (C) OpenMapTiles (C) OpenStreetMap contributors
- variant
- stamen_watercolor
- ext
- jpg
-
xyzservices.TileProviderStadia.StamenTerrain
- url
- https://tiles.stadiamaps.com/tiles/{variant}/{z}/{x}/{y}{r}.{ext}
- min_zoom
- 0
- max_zoom
- 18
- html_attribution
- © Stadia Maps © Stamen Design © OpenMapTiles © OpenStreetMap contributors
- attribution
- (C) Stadia Maps (C) Stamen Design (C) OpenMapTiles (C) OpenStreetMap contributors
- variant
- stamen_terrain
- ext
- png
-
xyzservices.TileProviderStadia.StamenTerrainBackground
- url
- https://tiles.stadiamaps.com/tiles/{variant}/{z}/{x}/{y}{r}.{ext}
- min_zoom
- 0
- max_zoom
- 18
- html_attribution
- © Stadia Maps © Stamen Design © OpenMapTiles © OpenStreetMap contributors
- attribution
- (C) Stadia Maps (C) Stamen Design (C) OpenMapTiles (C) OpenStreetMap contributors
- variant
- stamen_terrain_background
- ext
- png
-
xyzservices.TileProviderStadia.StamenTerrainLabels
- url
- https://tiles.stadiamaps.com/tiles/{variant}/{z}/{x}/{y}{r}.{ext}
- min_zoom
- 0
- max_zoom
- 18
- html_attribution
- © Stadia Maps © Stamen Design © OpenMapTiles © OpenStreetMap contributors
- attribution
- (C) Stadia Maps (C) Stamen Design (C) OpenMapTiles (C) OpenStreetMap contributors
- variant
- stamen_terrain_labels
- ext
- png
-
xyzservices.TileProviderStadia.StamenTerrainLines
- url
- https://tiles.stadiamaps.com/tiles/{variant}/{z}/{x}/{y}{r}.{ext}
- min_zoom
- 0
- max_zoom
- 18
- html_attribution
- © Stadia Maps © Stamen Design © OpenMapTiles © OpenStreetMap contributors
- attribution
- (C) Stadia Maps (C) Stamen Design (C) OpenMapTiles (C) OpenStreetMap contributors
- variant
- stamen_terrain_lines
- ext
- png
-
-
xyzservices.Bunch9 items
-
xyzservices.TileProviderThunderforest.OpenCycleMap
- url
- https://{s}.tile.thunderforest.com/{variant}/{z}/{x}/{y}.png?apikey={apikey}
- html_attribution
- © Thunderforest, © OpenStreetMap contributors
- attribution
- (C) Thunderforest, (C) OpenStreetMap contributors
- variant
- cycle
- apikey
- max_zoom
- 22
-
xyzservices.TileProviderThunderforest.Transport
- url
- https://{s}.tile.thunderforest.com/{variant}/{z}/{x}/{y}.png?apikey={apikey}
- html_attribution
- © Thunderforest, © OpenStreetMap contributors
- attribution
- (C) Thunderforest, (C) OpenStreetMap contributors
- variant
- transport
- apikey
- max_zoom
- 22
-
xyzservices.TileProviderThunderforest.TransportDark
- url
- https://{s}.tile.thunderforest.com/{variant}/{z}/{x}/{y}.png?apikey={apikey}
- html_attribution
- © Thunderforest, © OpenStreetMap contributors
- attribution
- (C) Thunderforest, (C) OpenStreetMap contributors
- variant
- transport-dark
- apikey
- max_zoom
- 22
-
xyzservices.TileProviderThunderforest.SpinalMap
- url
- https://{s}.tile.thunderforest.com/{variant}/{z}/{x}/{y}.png?apikey={apikey}
- html_attribution
- © Thunderforest, © OpenStreetMap contributors
- attribution
- (C) Thunderforest, (C) OpenStreetMap contributors
- variant
- spinal-map
- apikey
- max_zoom
- 22
-
xyzservices.TileProviderThunderforest.Landscape
- url
- https://{s}.tile.thunderforest.com/{variant}/{z}/{x}/{y}.png?apikey={apikey}
- html_attribution
- © Thunderforest, © OpenStreetMap contributors
- attribution
- (C) Thunderforest, (C) OpenStreetMap contributors
- variant
- landscape
- apikey
- max_zoom
- 22
-
xyzservices.TileProviderThunderforest.Outdoors
- url
- https://{s}.tile.thunderforest.com/{variant}/{z}/{x}/{y}.png?apikey={apikey}
- html_attribution
- © Thunderforest, © OpenStreetMap contributors
- attribution
- (C) Thunderforest, (C) OpenStreetMap contributors
- variant
- outdoors
- apikey
- max_zoom
- 22
-
xyzservices.TileProviderThunderforest.Pioneer
- url
- https://{s}.tile.thunderforest.com/{variant}/{z}/{x}/{y}.png?apikey={apikey}
- html_attribution
- © Thunderforest, © OpenStreetMap contributors
- attribution
- (C) Thunderforest, (C) OpenStreetMap contributors
- variant
- pioneer
- apikey
- max_zoom
- 22
-
xyzservices.TileProviderThunderforest.MobileAtlas
- url
- https://{s}.tile.thunderforest.com/{variant}/{z}/{x}/{y}.png?apikey={apikey}
- html_attribution
- © Thunderforest, © OpenStreetMap contributors
- attribution
- (C) Thunderforest, (C) OpenStreetMap contributors
- variant
- mobile-atlas
- apikey
- max_zoom
- 22
-
xyzservices.TileProviderThunderforest.Neighbourhood
- url
- https://{s}.tile.thunderforest.com/{variant}/{z}/{x}/{y}.png?apikey={apikey}
- html_attribution
- © Thunderforest, © OpenStreetMap contributors
- attribution
- (C) Thunderforest, (C) OpenStreetMap contributors
- variant
- neighbourhood
- apikey
- max_zoom
- 22
-
-
xyzservices.TileProviderCyclOSM
- url
- https://{s}.tile-cyclosm.openstreetmap.fr/cyclosm/{z}/{x}/{y}.png
- max_zoom
- 20
- html_attribution
- CyclOSM | Map data: © OpenStreetMap contributors
- attribution
- CyclOSM | Map data: (C) OpenStreetMap contributors
-
xyzservices.Bunch6 items
-
xyzservices.TileProviderJawg.Streets
- url
- https://{s}.tile.jawg.io/{variant}/{z}/{x}/{y}{r}.png?access-token={accessToken}
- html_attribution
- © JawgMaps © OpenStreetMap contributors
- attribution
- (C) **Jawg** Maps (C) OpenStreetMap contributors
- min_zoom
- 0
- max_zoom
- 22
- subdomains
- abcd
- variant
- jawg-streets
- accessToken
-
xyzservices.TileProviderJawg.Terrain
- url
- https://{s}.tile.jawg.io/{variant}/{z}/{x}/{y}{r}.png?access-token={accessToken}
- html_attribution
- © JawgMaps © OpenStreetMap contributors
- attribution
- (C) **Jawg** Maps (C) OpenStreetMap contributors
- min_zoom
- 0
- max_zoom
- 22
- subdomains
- abcd
- variant
- jawg-terrain
- accessToken
-
xyzservices.TileProviderJawg.Sunny
- url
- https://{s}.tile.jawg.io/{variant}/{z}/{x}/{y}{r}.png?access-token={accessToken}
- html_attribution
- © JawgMaps © OpenStreetMap contributors
- attribution
- (C) **Jawg** Maps (C) OpenStreetMap contributors
- min_zoom
- 0
- max_zoom
- 22
- subdomains
- abcd
- variant
- jawg-sunny
- accessToken
-
xyzservices.TileProviderJawg.Dark
- url
- https://{s}.tile.jawg.io/{variant}/{z}/{x}/{y}{r}.png?access-token={accessToken}
- html_attribution
- © JawgMaps © OpenStreetMap contributors
- attribution
- (C) **Jawg** Maps (C) OpenStreetMap contributors
- min_zoom
- 0
- max_zoom
- 22
- subdomains
- abcd
- variant
- jawg-dark
- accessToken
-
xyzservices.TileProviderJawg.Light
- url
- https://{s}.tile.jawg.io/{variant}/{z}/{x}/{y}{r}.png?access-token={accessToken}
- html_attribution
- © JawgMaps © OpenStreetMap contributors
- attribution
- (C) **Jawg** Maps (C) OpenStreetMap contributors
- min_zoom
- 0
- max_zoom
- 22
- subdomains
- abcd
- variant
- jawg-light
- accessToken
-
xyzservices.TileProviderJawg.Matrix
- url
- https://{s}.tile.jawg.io/{variant}/{z}/{x}/{y}{r}.png?access-token={accessToken}
- html_attribution
- © JawgMaps © OpenStreetMap contributors
- attribution
- (C) **Jawg** Maps (C) OpenStreetMap contributors
- min_zoom
- 0
- max_zoom
- 22
- subdomains
- abcd
- variant
- jawg-matrix
- accessToken
-
-
xyzservices.TileProviderMapBox
- url
- https://api.mapbox.com/styles/v1/{id}/tiles/{z}/{x}/{y}{r}?access_token={accessToken}
- html_attribution
- © Mapbox © OpenStreetMap contributors Improve this map
- attribution
- (C) Mapbox (C) OpenStreetMap contributors Improve this map
- tileSize
- 512
- max_zoom
- 18
- zoomOffset
- -1
- id
- mapbox/streets-v11
- accessToken
-
xyzservices.Bunch15 items
-
xyzservices.TileProviderMapTiler.Streets
- url
- https://api.maptiler.com/maps/{variant}/{z}/{x}/{y}{r}.{ext}?key={key}
- html_attribution
- © MapTiler © OpenStreetMap contributors
- attribution
- (C) MapTiler (C) OpenStreetMap contributors
- variant
- streets
- ext
- png
- key
- tileSize
- 512
- zoomOffset
- -1
- min_zoom
- 0
- max_zoom
- 21
-
xyzservices.TileProviderMapTiler.Basic
- url
- https://api.maptiler.com/maps/{variant}/{z}/{x}/{y}{r}.{ext}?key={key}
- html_attribution
- © MapTiler © OpenStreetMap contributors
- attribution
- (C) MapTiler (C) OpenStreetMap contributors
- variant
- basic
- ext
- png
- key
- tileSize
- 512
- zoomOffset
- -1
- min_zoom
- 0
- max_zoom
- 21
-
xyzservices.TileProviderMapTiler.Bright
- url
- https://api.maptiler.com/maps/{variant}/{z}/{x}/{y}{r}.{ext}?key={key}
- html_attribution
- © MapTiler © OpenStreetMap contributors
- attribution
- (C) MapTiler (C) OpenStreetMap contributors
- variant
- bright
- ext
- png
- key
- tileSize
- 512
- zoomOffset
- -1
- min_zoom
- 0
- max_zoom
- 21
-
xyzservices.TileProviderMapTiler.Pastel
- url
- https://api.maptiler.com/maps/{variant}/{z}/{x}/{y}{r}.{ext}?key={key}
- html_attribution
- © MapTiler © OpenStreetMap contributors
- attribution
- (C) MapTiler (C) OpenStreetMap contributors
- variant
- pastel
- ext
- png
- key
- tileSize
- 512
- zoomOffset
- -1
- min_zoom
- 0
- max_zoom
- 21
-
xyzservices.TileProviderMapTiler.Positron
- url
- https://api.maptiler.com/maps/{variant}/{z}/{x}/{y}{r}.{ext}?key={key}
- html_attribution
- © MapTiler © OpenStreetMap contributors
- attribution
- (C) MapTiler (C) OpenStreetMap contributors
- variant
- positron
- ext
- png
- key
- tileSize
- 512
- zoomOffset
- -1
- min_zoom
- 0
- max_zoom
- 21
-
xyzservices.TileProviderMapTiler.Hybrid
- url
- https://api.maptiler.com/maps/{variant}/{z}/{x}/{y}{r}.{ext}?key={key}
- html_attribution
- © MapTiler © OpenStreetMap contributors
- attribution
- (C) MapTiler (C) OpenStreetMap contributors
- variant
- hybrid
- ext
- jpg
- key
- tileSize
- 512
- zoomOffset
- -1
- min_zoom
- 0
- max_zoom
- 21
-
xyzservices.TileProviderMapTiler.Toner
- url
- https://api.maptiler.com/maps/{variant}/{z}/{x}/{y}{r}.{ext}?key={key}
- html_attribution
- © MapTiler © OpenStreetMap contributors
- attribution
- (C) MapTiler (C) OpenStreetMap contributors
- variant
- toner
- ext
- png
- key
- tileSize
- 512
- zoomOffset
- -1
- min_zoom
- 0
- max_zoom
- 21
-
xyzservices.TileProviderMapTiler.Topo
- url
- https://api.maptiler.com/maps/{variant}/{z}/{x}/{y}{r}.{ext}?key={key}
- html_attribution
- © MapTiler © OpenStreetMap contributors
- attribution
- (C) MapTiler (C) OpenStreetMap contributors
- variant
- topo
- ext
- png
- key
- tileSize
- 512
- zoomOffset
- -1
- min_zoom
- 0
- max_zoom
- 21
-
xyzservices.TileProviderMapTiler.Voyager
- url
- https://api.maptiler.com/maps/{variant}/{z}/{x}/{y}{r}.{ext}?key={key}
- html_attribution
- © MapTiler © OpenStreetMap contributors
- attribution
- (C) MapTiler (C) OpenStreetMap contributors
- variant
- voyager
- ext
- png
- key
- tileSize
- 512
- zoomOffset
- -1
- min_zoom
- 0
- max_zoom
- 21
-
xyzservices.TileProviderMapTiler.Basic4326
- url
- https://api.maptiler.com/maps/{variant}/{z}/{x}/{y}{r}.{ext}?key={key}
- html_attribution
- © MapTiler © OpenStreetMap contributors
- attribution
- (C) MapTiler (C) OpenStreetMap contributors
- variant
- basic-4326
- ext
- png
- key
- tileSize
- 512
- zoomOffset
- -1
- min_zoom
- 0
- max_zoom
- 21
- crs
- EPSG:4326
-
xyzservices.TileProviderMapTiler.Outdoor
- url
- https://api.maptiler.com/maps/{variant}/{z}/{x}/{y}{r}.{ext}?key={key}
- html_attribution
- © MapTiler © OpenStreetMap contributors
- attribution
- (C) MapTiler (C) OpenStreetMap contributors
- variant
- outdoor
- ext
- png
- key
- tileSize
- 512
- zoomOffset
- -1
- min_zoom
- 0
- max_zoom
- 21
-
xyzservices.TileProviderMapTiler.Topographique
- url
- https://api.maptiler.com/maps/{variant}/{z}/{x}/{y}{r}.{ext}?key={key}
- html_attribution
- © MapTiler © OpenStreetMap contributors
- attribution
- (C) MapTiler (C) OpenStreetMap contributors
- variant
- topographique
- ext
- png
- key
- tileSize
- 512
- zoomOffset
- -1
- min_zoom
- 0
- max_zoom
- 21
-
xyzservices.TileProviderMapTiler.Winter
- url
- https://api.maptiler.com/maps/{variant}/{z}/{x}/{y}{r}.{ext}?key={key}
- html_attribution
- © MapTiler © OpenStreetMap contributors
- attribution
- (C) MapTiler (C) OpenStreetMap contributors
- variant
- winter
- ext
- png
- key
- tileSize
- 512
- zoomOffset
- -1
- min_zoom
- 0
- max_zoom
- 21
-
xyzservices.TileProviderMapTiler.Satellite
- url
- https://api.maptiler.com/tiles/{variant}/{z}/{x}/{y}.{ext}?key={key}
- html_attribution
- © MapTiler © OpenStreetMap contributors
- attribution
- (C) MapTiler (C) OpenStreetMap contributors
- variant
- satellite-v2
- ext
- jpg
- key
- min_zoom
- 0
- max_zoom
- 20
-
xyzservices.TileProviderMapTiler.Terrain
- url
- https://api.maptiler.com/tiles/{variant}/{z}/{x}/{y}.{ext}?key={key}
- html_attribution
- © MapTiler © OpenStreetMap contributors
- attribution
- (C) MapTiler (C) OpenStreetMap contributors
- variant
- terrain-rgb
- ext
- png
- key
- min_zoom
- 0
- max_zoom
- 12
-
-
xyzservices.Bunch3 items
-
xyzservices.TileProviderTomTom.Basic
- url
- https://{s}.api.tomtom.com/map/1/tile/{variant}/{style}/{z}/{x}/{y}.{ext}?key={apikey}
- variant
- basic
- max_zoom
- 22
- html_attribution
- © 1992 - 2023 TomTom.
- attribution
- (C) 1992 - 2023 TomTom.
- subdomains
- abcd
- style
- main
- ext
- png
- apikey
-
xyzservices.TileProviderTomTom.Hybrid
- url
- https://{s}.api.tomtom.com/map/1/tile/{variant}/{style}/{z}/{x}/{y}.{ext}?key={apikey}
- variant
- hybrid
- max_zoom
- 22
- html_attribution
- © 1992 - 2023 TomTom.
- attribution
- (C) 1992 - 2023 TomTom.
- subdomains
- abcd
- style
- main
- ext
- png
- apikey
-
xyzservices.TileProviderTomTom.Labels
- url
- https://{s}.api.tomtom.com/map/1/tile/{variant}/{style}/{z}/{x}/{y}.{ext}?key={apikey}
- variant
- labels
- max_zoom
- 22
- html_attribution
- © 1992 - 2023 TomTom.
- attribution
- (C) 1992 - 2023 TomTom.
- subdomains
- abcd
- style
- main
- ext
- png
- apikey
-
-
xyzservices.Bunch15 items
-
xyzservices.TileProviderEsri.WorldStreetMap
- url
- https://server.arcgisonline.com/ArcGIS/rest/services/{variant}/MapServer/tile/{z}/{y}/{x}
- variant
- World_Street_Map
- html_attribution
- Tiles © Esri — Source: Esri, DeLorme, NAVTEQ, USGS, Intermap, iPC, NRCAN, Esri Japan, METI, Esri China (Hong Kong), Esri (Thailand), TomTom, 2012
- attribution
- Tiles (C) Esri -- Source: Esri, DeLorme, NAVTEQ, USGS, Intermap, iPC, NRCAN, Esri Japan, METI, Esri China (Hong Kong), Esri (Thailand), TomTom, 2012
-
xyzservices.TileProviderEsri.DeLorme
- url
- https://server.arcgisonline.com/ArcGIS/rest/services/{variant}/MapServer/tile/{z}/{y}/{x}
- variant
- Specialty/DeLorme_World_Base_Map
- html_attribution
- Tiles © Esri — Copyright: ©2012 DeLorme
- attribution
- Tiles (C) Esri -- Copyright: (C)2012 DeLorme
- min_zoom
- 1
- max_zoom
- 11
-
xyzservices.TileProviderEsri.WorldTopoMap
- url
- https://server.arcgisonline.com/ArcGIS/rest/services/{variant}/MapServer/tile/{z}/{y}/{x}
- variant
- World_Topo_Map
- html_attribution
- Tiles © Esri — Esri, DeLorme, NAVTEQ, TomTom, Intermap, iPC, USGS, FAO, NPS, NRCAN, GeoBase, Kadaster NL, Ordnance Survey, Esri Japan, METI, Esri China (Hong Kong), and the GIS User Community
- attribution
- Tiles (C) Esri -- Esri, DeLorme, NAVTEQ, TomTom, Intermap, iPC, USGS, FAO, NPS, NRCAN, GeoBase, Kadaster NL, Ordnance Survey, Esri Japan, METI, Esri China (Hong Kong), and the GIS User Community
-
xyzservices.TileProviderEsri.WorldImagery
- url
- https://server.arcgisonline.com/ArcGIS/rest/services/{variant}/MapServer/tile/{z}/{y}/{x}
- variant
- World_Imagery
- html_attribution
- Tiles © Esri — Source: Esri, i-cubed, USDA, USGS, AEX, GeoEye, Getmapping, Aerogrid, IGN, IGP, UPR-EGP, and the GIS User Community
- attribution
- Tiles (C) Esri -- Source: Esri, i-cubed, USDA, USGS, AEX, GeoEye, Getmapping, Aerogrid, IGN, IGP, UPR-EGP, and the GIS User Community
-
xyzservices.TileProviderEsri.WorldTerrain
- url
- https://server.arcgisonline.com/ArcGIS/rest/services/{variant}/MapServer/tile/{z}/{y}/{x}
- variant
- World_Terrain_Base
- html_attribution
- Tiles © Esri — Source: USGS, Esri, TANA, DeLorme, and NPS
- attribution
- Tiles (C) Esri -- Source: USGS, Esri, TANA, DeLorme, and NPS
- max_zoom
- 13
-
xyzservices.TileProviderEsri.WorldShadedRelief
- url
- https://server.arcgisonline.com/ArcGIS/rest/services/{variant}/MapServer/tile/{z}/{y}/{x}
- variant
- World_Shaded_Relief
- html_attribution
- Tiles © Esri — Source: Esri
- attribution
- Tiles (C) Esri -- Source: Esri
- max_zoom
- 13
-
xyzservices.TileProviderEsri.WorldPhysical
- url
- https://server.arcgisonline.com/ArcGIS/rest/services/{variant}/MapServer/tile/{z}/{y}/{x}
- variant
- World_Physical_Map
- html_attribution
- Tiles © Esri — Source: US National Park Service
- attribution
- Tiles (C) Esri -- Source: US National Park Service
- max_zoom
- 8
-
xyzservices.TileProviderEsri.OceanBasemap
- url
- https://server.arcgisonline.com/ArcGIS/rest/services/{variant}/MapServer/tile/{z}/{y}/{x}
- variant
- Ocean/World_Ocean_Base
- html_attribution
- Tiles © Esri — Sources: GEBCO, NOAA, CHS, OSU, UNH, CSUMB, National Geographic, DeLorme, NAVTEQ, and Esri
- attribution
- Tiles (C) Esri -- Sources: GEBCO, NOAA, CHS, OSU, UNH, CSUMB, National Geographic, DeLorme, NAVTEQ, and Esri
- max_zoom
- 13
-
xyzservices.TileProviderEsri.NatGeoWorldMap
- url
- https://server.arcgisonline.com/ArcGIS/rest/services/{variant}/MapServer/tile/{z}/{y}/{x}
- variant
- NatGeo_World_Map
- html_attribution
- Tiles © Esri — National Geographic, Esri, DeLorme, NAVTEQ, UNEP-WCMC, USGS, NASA, ESA, METI, NRCAN, GEBCO, NOAA, iPC
- attribution
- Tiles (C) Esri -- National Geographic, Esri, DeLorme, NAVTEQ, UNEP-WCMC, USGS, NASA, ESA, METI, NRCAN, GEBCO, NOAA, iPC
- max_zoom
- 16
-
xyzservices.TileProviderEsri.WorldGrayCanvas
- url
- https://server.arcgisonline.com/ArcGIS/rest/services/{variant}/MapServer/tile/{z}/{y}/{x}
- variant
- Canvas/World_Light_Gray_Base
- html_attribution
- Tiles © Esri — Esri, DeLorme, NAVTEQ
- attribution
- Tiles (C) Esri -- Esri, DeLorme, NAVTEQ
- max_zoom
- 16
-
xyzservices.TileProviderEsri.ArcticImagery
- url
- http://server.arcgisonline.com/ArcGIS/rest/services/Polar/Arctic_Imagery/MapServer/tile/{z}/{y}/{x}
- variant
- Arctic_Imagery
- html_attribution
- Earthstar Geographics
- attribution
- Earthstar Geographics
- max_zoom
- 24
- crs
- EPSG:5936
- bounds
- [[-2623285.8808999993, -2623285.8808999993], [6623285.8803, 6623285.8803]]
-
xyzservices.TileProviderEsri.ArcticOceanBase
- url
- http://server.arcgisonline.com/ArcGIS/rest/services/Polar/Arctic_Ocean_Base/MapServer/tile/{z}/{y}/{x}
- variant
- Arctic_Ocean_Base
- html_attribution
- Tiles © Esri — Esri, DeLorme, NAVTEQ, TomTom, Intermap, iPC, USGS, FAO, NPS, NRCAN, GeoBase, Kadaster NL, Ordnance Survey, Esri Japan, METI, Esri China (Hong Kong), and the GIS User Community
- attribution
- Tiles © Esri — Esri, DeLorme, NAVTEQ, TomTom, Intermap, iPC, USGS, FAO, NPS, NRCAN, GeoBase, Kadaster NL, Ordnance Survey, Esri Japan, METI, Esri China (Hong Kong), and the GIS User Community
- max_zoom
- 24
- crs
- EPSG:5936
- bounds
- [[-2623285.8808999993, -2623285.8808999993], [6623285.8803, 6623285.8803]]
-
xyzservices.TileProviderEsri.ArcticOceanReference
- url
- http://server.arcgisonline.com/ArcGIS/rest/services/Polar/Arctic_Ocean_Reference/MapServer/tile/{z}/{y}/{x}
- variant
- Arctic_Ocean_Reference
- html_attribution
- Tiles © Esri — Esri, DeLorme, NAVTEQ, TomTom, Intermap, iPC, USGS, FAO, NPS, NRCAN, GeoBase, Kadaster NL, Ordnance Survey, Esri Japan, METI, Esri China (Hong Kong), and the GIS User Community
- attribution
- Tiles © Esri — Esri, DeLorme, NAVTEQ, TomTom, Intermap, iPC, USGS, FAO, NPS, NRCAN, GeoBase, Kadaster NL, Ordnance Survey, Esri Japan, METI, Esri China (Hong Kong), and the GIS User Community
- max_zoom
- 24
- crs
- EPSG:5936
- bounds
- [[-2623285.8808999993, -2623285.8808999993], [6623285.8803, 6623285.8803]]
-
xyzservices.TileProviderEsri.AntarcticImagery
- url
- http://server.arcgisonline.com/ArcGIS/rest/services/Polar/Antarctic_Imagery/MapServer/tile/{z}/{y}/{x}
- variant
- Antarctic_Imagery
- html_attribution
- Earthstar Geographics
- attribution
- Earthstar Geographics
- max_zoom
- 24
- crs
- EPSG:3031
- bounds
- [[-9913957.327914657, -5730886.461772691], [9913957.327914657, 5730886.461773157]]
-
xyzservices.TileProviderEsri.AntarcticBasemap
- url
- https://tiles.arcgis.com/tiles/C8EMgrsFcRFL6LrL/arcgis/rest/services/Antarctic_Basemap/MapServer/tile/{z}/{y}/{x}
- variant
- Antarctic_Basemap
- html_attribution
- Imagery provided by NOAA National Centers for Environmental Information (NCEI); International Bathymetric Chart of the Southern Ocean (IBCSO); General Bathymetric Chart of the Oceans (GEBCO).
- attribution
- Imagery provided by NOAA National Centers for Environmental Information (NCEI); International Bathymetric Chart of the Southern Ocean (IBCSO); General Bathymetric Chart of the Oceans (GEBCO).
- max_zoom
- 9
- crs
- EPSG:3031
- bounds
- [[-4524583.19363305, -4524449.487765655], [4524449.4877656475, 4524583.193633042]]
-
-
xyzservices.Bunch11 items
-
xyzservices.TileProviderOpenWeatherMap.Clouds
- url
- http://{s}.tile.openweathermap.org/map/{variant}/{z}/{x}/{y}.png?appid={apiKey}
- max_zoom
- 19
- html_attribution
- Map data © OpenWeatherMap
- attribution
- Map data (C) OpenWeatherMap
- apiKey
- opacity
- 0.5
- variant
- clouds
-
xyzservices.TileProviderOpenWeatherMap.CloudsClassic
- url
- http://{s}.tile.openweathermap.org/map/{variant}/{z}/{x}/{y}.png?appid={apiKey}
- max_zoom
- 19
- html_attribution
- Map data © OpenWeatherMap
- attribution
- Map data (C) OpenWeatherMap
- apiKey
- opacity
- 0.5
- variant
- clouds_cls
-
xyzservices.TileProviderOpenWeatherMap.Precipitation
- url
- http://{s}.tile.openweathermap.org/map/{variant}/{z}/{x}/{y}.png?appid={apiKey}
- max_zoom
- 19
- html_attribution
- Map data © OpenWeatherMap
- attribution
- Map data (C) OpenWeatherMap
- apiKey
- opacity
- 0.5
- variant
- precipitation
-
xyzservices.TileProviderOpenWeatherMap.PrecipitationClassic
- url
- http://{s}.tile.openweathermap.org/map/{variant}/{z}/{x}/{y}.png?appid={apiKey}
- max_zoom
- 19
- html_attribution
- Map data © OpenWeatherMap
- attribution
- Map data (C) OpenWeatherMap
- apiKey
- opacity
- 0.5
- variant
- precipitation_cls
-
xyzservices.TileProviderOpenWeatherMap.Rain
- url
- http://{s}.tile.openweathermap.org/map/{variant}/{z}/{x}/{y}.png?appid={apiKey}
- max_zoom
- 19
- html_attribution
- Map data © OpenWeatherMap
- attribution
- Map data (C) OpenWeatherMap
- apiKey
- opacity
- 0.5
- variant
- rain
-
xyzservices.TileProviderOpenWeatherMap.RainClassic
- url
- http://{s}.tile.openweathermap.org/map/{variant}/{z}/{x}/{y}.png?appid={apiKey}
- max_zoom
- 19
- html_attribution
- Map data © OpenWeatherMap
- attribution
- Map data (C) OpenWeatherMap
- apiKey
- opacity
- 0.5
- variant
- rain_cls
-
xyzservices.TileProviderOpenWeatherMap.Pressure
- url
- http://{s}.tile.openweathermap.org/map/{variant}/{z}/{x}/{y}.png?appid={apiKey}
- max_zoom
- 19
- html_attribution
- Map data © OpenWeatherMap
- attribution
- Map data (C) OpenWeatherMap
- apiKey
- opacity
- 0.5
- variant
- pressure
-
xyzservices.TileProviderOpenWeatherMap.PressureContour
- url
- http://{s}.tile.openweathermap.org/map/{variant}/{z}/{x}/{y}.png?appid={apiKey}
- max_zoom
- 19
- html_attribution
- Map data © OpenWeatherMap
- attribution
- Map data (C) OpenWeatherMap
- apiKey
- opacity
- 0.5
- variant
- pressure_cntr
-
xyzservices.TileProviderOpenWeatherMap.Wind
- url
- http://{s}.tile.openweathermap.org/map/{variant}/{z}/{x}/{y}.png?appid={apiKey}
- max_zoom
- 19
- html_attribution
- Map data © OpenWeatherMap
- attribution
- Map data (C) OpenWeatherMap
- apiKey
- opacity
- 0.5
- variant
- wind
-
xyzservices.TileProviderOpenWeatherMap.Temperature
- url
- http://{s}.tile.openweathermap.org/map/{variant}/{z}/{x}/{y}.png?appid={apiKey}
- max_zoom
- 19
- html_attribution
- Map data © OpenWeatherMap
- attribution
- Map data (C) OpenWeatherMap
- apiKey
- opacity
- 0.5
- variant
- temp
-
xyzservices.TileProviderOpenWeatherMap.Snow
- url
- http://{s}.tile.openweathermap.org/map/{variant}/{z}/{x}/{y}.png?appid={apiKey}
- max_zoom
- 19
- html_attribution
- Map data © OpenWeatherMap
- attribution
- Map data (C) OpenWeatherMap
- apiKey
- opacity
- 0.5
- variant
- snow
-
-
xyzservices.Bunch30 items
-
xyzservices.TileProviderHERE.normalDay
- url
- https://{s}.{base}.maps.api.here.com/maptile/2.1/{type}/{mapID}/{variant}/{z}/{x}/{y}/{size}/{format}?app_id={app_id}&app_code={app_code}&lg={language}
- html_attribution
- Map © 1987-2023 HERE
- attribution
- Map (C) 1987-2023 HERE
- subdomains
- 1234
- mapID
- newest
- app_id
- app_code
- base
- base
- variant
- normal.day
- max_zoom
- 20
- type
- maptile
- language
- eng
- format
- png8
- size
- 256
-
xyzservices.TileProviderHERE.normalDayCustom
- url
- https://{s}.{base}.maps.api.here.com/maptile/2.1/{type}/{mapID}/{variant}/{z}/{x}/{y}/{size}/{format}?app_id={app_id}&app_code={app_code}&lg={language}
- html_attribution
- Map © 1987-2023 HERE
- attribution
- Map (C) 1987-2023 HERE
- subdomains
- 1234
- mapID
- newest
- app_id
- app_code
- base
- base
- variant
- normal.day.custom
- max_zoom
- 20
- type
- maptile
- language
- eng
- format
- png8
- size
- 256
-
xyzservices.TileProviderHERE.normalDayGrey
- url
- https://{s}.{base}.maps.api.here.com/maptile/2.1/{type}/{mapID}/{variant}/{z}/{x}/{y}/{size}/{format}?app_id={app_id}&app_code={app_code}&lg={language}
- html_attribution
- Map © 1987-2023 HERE
- attribution
- Map (C) 1987-2023 HERE
- subdomains
- 1234
- mapID
- newest
- app_id
- app_code
- base
- base
- variant
- normal.day.grey
- max_zoom
- 20
- type
- maptile
- language
- eng
- format
- png8
- size
- 256
-
xyzservices.TileProviderHERE.normalDayMobile
- url
- https://{s}.{base}.maps.api.here.com/maptile/2.1/{type}/{mapID}/{variant}/{z}/{x}/{y}/{size}/{format}?app_id={app_id}&app_code={app_code}&lg={language}
- html_attribution
- Map © 1987-2023 HERE
- attribution
- Map (C) 1987-2023 HERE
- subdomains
- 1234
- mapID
- newest
- app_id
- app_code
- base
- base
- variant
- normal.day.mobile
- max_zoom
- 20
- type
- maptile
- language
- eng
- format
- png8
- size
- 256
-
xyzservices.TileProviderHERE.normalDayGreyMobile
- url
- https://{s}.{base}.maps.api.here.com/maptile/2.1/{type}/{mapID}/{variant}/{z}/{x}/{y}/{size}/{format}?app_id={app_id}&app_code={app_code}&lg={language}
- html_attribution
- Map © 1987-2023 HERE
- attribution
- Map (C) 1987-2023 HERE
- subdomains
- 1234
- mapID
- newest
- app_id
- app_code
- base
- base
- variant
- normal.day.grey.mobile
- max_zoom
- 20
- type
- maptile
- language
- eng
- format
- png8
- size
- 256
-
xyzservices.TileProviderHERE.normalDayTransit
- url
- https://{s}.{base}.maps.api.here.com/maptile/2.1/{type}/{mapID}/{variant}/{z}/{x}/{y}/{size}/{format}?app_id={app_id}&app_code={app_code}&lg={language}
- html_attribution
- Map © 1987-2023 HERE
- attribution
- Map (C) 1987-2023 HERE
- subdomains
- 1234
- mapID
- newest
- app_id
- app_code
- base
- base
- variant
- normal.day.transit
- max_zoom
- 20
- type
- maptile
- language
- eng
- format
- png8
- size
- 256
-
xyzservices.TileProviderHERE.normalDayTransitMobile
- url
- https://{s}.{base}.maps.api.here.com/maptile/2.1/{type}/{mapID}/{variant}/{z}/{x}/{y}/{size}/{format}?app_id={app_id}&app_code={app_code}&lg={language}
- html_attribution
- Map © 1987-2023 HERE
- attribution
- Map (C) 1987-2023 HERE
- subdomains
- 1234
- mapID
- newest
- app_id
- app_code
- base
- base
- variant
- normal.day.transit.mobile
- max_zoom
- 20
- type
- maptile
- language
- eng
- format
- png8
- size
- 256
-
xyzservices.TileProviderHERE.normalDayTraffic
- url
- https://{s}.{base}.maps.api.here.com/maptile/2.1/{type}/{mapID}/{variant}/{z}/{x}/{y}/{size}/{format}?app_id={app_id}&app_code={app_code}&lg={language}
- html_attribution
- Map © 1987-2023 HERE
- attribution
- Map (C) 1987-2023 HERE
- subdomains
- 1234
- mapID
- newest
- app_id
- app_code
- base
- traffic
- variant
- normal.traffic.day
- max_zoom
- 20
- type
- traffictile
- language
- eng
- format
- png8
- size
- 256
-
xyzservices.TileProviderHERE.normalNight
- url
- https://{s}.{base}.maps.api.here.com/maptile/2.1/{type}/{mapID}/{variant}/{z}/{x}/{y}/{size}/{format}?app_id={app_id}&app_code={app_code}&lg={language}
- html_attribution
- Map © 1987-2023 HERE
- attribution
- Map (C) 1987-2023 HERE
- subdomains
- 1234
- mapID
- newest
- app_id
- app_code
- base
- base
- variant
- normal.night
- max_zoom
- 20
- type
- maptile
- language
- eng
- format
- png8
- size
- 256
-
xyzservices.TileProviderHERE.normalNightMobile
- url
- https://{s}.{base}.maps.api.here.com/maptile/2.1/{type}/{mapID}/{variant}/{z}/{x}/{y}/{size}/{format}?app_id={app_id}&app_code={app_code}&lg={language}
- html_attribution
- Map © 1987-2023 HERE
- attribution
- Map (C) 1987-2023 HERE
- subdomains
- 1234
- mapID
- newest
- app_id
- app_code
- base
- base
- variant
- normal.night.mobile
- max_zoom
- 20
- type
- maptile
- language
- eng
- format
- png8
- size
- 256
-
xyzservices.TileProviderHERE.normalNightGrey
- url
- https://{s}.{base}.maps.api.here.com/maptile/2.1/{type}/{mapID}/{variant}/{z}/{x}/{y}/{size}/{format}?app_id={app_id}&app_code={app_code}&lg={language}
- html_attribution
- Map © 1987-2023 HERE
- attribution
- Map (C) 1987-2023 HERE
- subdomains
- 1234
- mapID
- newest
- app_id
- app_code
- base
- base
- variant
- normal.night.grey
- max_zoom
- 20
- type
- maptile
- language
- eng
- format
- png8
- size
- 256
-
xyzservices.TileProviderHERE.normalNightGreyMobile
- url
- https://{s}.{base}.maps.api.here.com/maptile/2.1/{type}/{mapID}/{variant}/{z}/{x}/{y}/{size}/{format}?app_id={app_id}&app_code={app_code}&lg={language}
- html_attribution
- Map © 1987-2023 HERE
- attribution
- Map (C) 1987-2023 HERE
- subdomains
- 1234
- mapID
- newest
- app_id
- app_code
- base
- base
- variant
- normal.night.grey.mobile
- max_zoom
- 20
- type
- maptile
- language
- eng
- format
- png8
- size
- 256
-
xyzservices.TileProviderHERE.normalNightTransit
- url
- https://{s}.{base}.maps.api.here.com/maptile/2.1/{type}/{mapID}/{variant}/{z}/{x}/{y}/{size}/{format}?app_id={app_id}&app_code={app_code}&lg={language}
- html_attribution
- Map © 1987-2023 HERE
- attribution
- Map (C) 1987-2023 HERE
- subdomains
- 1234
- mapID
- newest
- app_id
- app_code
- base
- base
- variant
- normal.night.transit
- max_zoom
- 20
- type
- maptile
- language
- eng
- format
- png8
- size
- 256
-
xyzservices.TileProviderHERE.normalNightTransitMobile
- url
- https://{s}.{base}.maps.api.here.com/maptile/2.1/{type}/{mapID}/{variant}/{z}/{x}/{y}/{size}/{format}?app_id={app_id}&app_code={app_code}&lg={language}
- html_attribution
- Map © 1987-2023 HERE
- attribution
- Map (C) 1987-2023 HERE
- subdomains
- 1234
- mapID
- newest
- app_id
- app_code
- base
- base
- variant
- normal.night.transit.mobile
- max_zoom
- 20
- type
- maptile
- language
- eng
- format
- png8
- size
- 256
-
xyzservices.TileProviderHERE.reducedDay
- url
- https://{s}.{base}.maps.api.here.com/maptile/2.1/{type}/{mapID}/{variant}/{z}/{x}/{y}/{size}/{format}?app_id={app_id}&app_code={app_code}&lg={language}
- html_attribution
- Map © 1987-2023 HERE
- attribution
- Map (C) 1987-2023 HERE
- subdomains
- 1234
- mapID
- newest
- app_id
- app_code
- base
- base
- variant
- reduced.day
- max_zoom
- 20
- type
- maptile
- language
- eng
- format
- png8
- size
- 256
-
xyzservices.TileProviderHERE.reducedNight
- url
- https://{s}.{base}.maps.api.here.com/maptile/2.1/{type}/{mapID}/{variant}/{z}/{x}/{y}/{size}/{format}?app_id={app_id}&app_code={app_code}&lg={language}
- html_attribution
- Map © 1987-2023 HERE
- attribution
- Map (C) 1987-2023 HERE
- subdomains
- 1234
- mapID
- newest
- app_id
- app_code
- base
- base
- variant
- reduced.night
- max_zoom
- 20
- type
- maptile
- language
- eng
- format
- png8
- size
- 256
-
xyzservices.TileProviderHERE.basicMap
- url
- https://{s}.{base}.maps.api.here.com/maptile/2.1/{type}/{mapID}/{variant}/{z}/{x}/{y}/{size}/{format}?app_id={app_id}&app_code={app_code}&lg={language}
- html_attribution
- Map © 1987-2023 HERE
- attribution
- Map (C) 1987-2023 HERE
- subdomains
- 1234
- mapID
- newest
- app_id
- app_code
- base
- base
- variant
- normal.day
- max_zoom
- 20
- type
- basetile
- language
- eng
- format
- png8
- size
- 256
-
xyzservices.TileProviderHERE.mapLabels
- url
- https://{s}.{base}.maps.api.here.com/maptile/2.1/{type}/{mapID}/{variant}/{z}/{x}/{y}/{size}/{format}?app_id={app_id}&app_code={app_code}&lg={language}
- html_attribution
- Map © 1987-2023 HERE
- attribution
- Map (C) 1987-2023 HERE
- subdomains
- 1234
- mapID
- newest
- app_id
- app_code
- base
- base
- variant
- normal.day
- max_zoom
- 20
- type
- labeltile
- language
- eng
- format
- png
- size
- 256
-
xyzservices.TileProviderHERE.trafficFlow
- url
- https://{s}.{base}.maps.api.here.com/maptile/2.1/{type}/{mapID}/{variant}/{z}/{x}/{y}/{size}/{format}?app_id={app_id}&app_code={app_code}&lg={language}
- html_attribution
- Map © 1987-2023 HERE
- attribution
- Map (C) 1987-2023 HERE
- subdomains
- 1234
- mapID
- newest
- app_id
- app_code
- base
- traffic
- variant
- normal.day
- max_zoom
- 20
- type
- flowtile
- language
- eng
- format
- png8
- size
- 256
-
xyzservices.TileProviderHERE.carnavDayGrey
- url
- https://{s}.{base}.maps.api.here.com/maptile/2.1/{type}/{mapID}/{variant}/{z}/{x}/{y}/{size}/{format}?app_id={app_id}&app_code={app_code}&lg={language}
- html_attribution
- Map © 1987-2023 HERE
- attribution
- Map (C) 1987-2023 HERE
- subdomains
- 1234
- mapID
- newest
- app_id
- app_code
- base
- base
- variant
- carnav.day.grey
- max_zoom
- 20
- type
- maptile
- language
- eng
- format
- png8
- size
- 256
-
xyzservices.TileProviderHERE.hybridDay
- url
- https://{s}.{base}.maps.api.here.com/maptile/2.1/{type}/{mapID}/{variant}/{z}/{x}/{y}/{size}/{format}?app_id={app_id}&app_code={app_code}&lg={language}
- html_attribution
- Map © 1987-2023 HERE
- attribution
- Map (C) 1987-2023 HERE
- subdomains
- 1234
- mapID
- newest
- app_id
- app_code
- base
- aerial
- variant
- hybrid.day
- max_zoom
- 20
- type
- maptile
- language
- eng
- format
- png8
- size
- 256
-
xyzservices.TileProviderHERE.hybridDayMobile
- url
- https://{s}.{base}.maps.api.here.com/maptile/2.1/{type}/{mapID}/{variant}/{z}/{x}/{y}/{size}/{format}?app_id={app_id}&app_code={app_code}&lg={language}
- html_attribution
- Map © 1987-2023 HERE
- attribution
- Map (C) 1987-2023 HERE
- subdomains
- 1234
- mapID
- newest
- app_id
- app_code
- base
- aerial
- variant
- hybrid.day.mobile
- max_zoom
- 20
- type
- maptile
- language
- eng
- format
- png8
- size
- 256
-
xyzservices.TileProviderHERE.hybridDayTransit
- url
- https://{s}.{base}.maps.api.here.com/maptile/2.1/{type}/{mapID}/{variant}/{z}/{x}/{y}/{size}/{format}?app_id={app_id}&app_code={app_code}&lg={language}
- html_attribution
- Map © 1987-2023 HERE
- attribution
- Map (C) 1987-2023 HERE
- subdomains
- 1234
- mapID
- newest
- app_id
- app_code
- base
- aerial
- variant
- hybrid.day.transit
- max_zoom
- 20
- type
- maptile
- language
- eng
- format
- png8
- size
- 256
-
xyzservices.TileProviderHERE.hybridDayGrey
- url
- https://{s}.{base}.maps.api.here.com/maptile/2.1/{type}/{mapID}/{variant}/{z}/{x}/{y}/{size}/{format}?app_id={app_id}&app_code={app_code}&lg={language}
- html_attribution
- Map © 1987-2023 HERE
- attribution
- Map (C) 1987-2023 HERE
- subdomains
- 1234
- mapID
- newest
- app_id
- app_code
- base
- aerial
- variant
- hybrid.grey.day
- max_zoom
- 20
- type
- maptile
- language
- eng
- format
- png8
- size
- 256
-
xyzservices.TileProviderHERE.hybridDayTraffic
- url
- https://{s}.{base}.maps.api.here.com/maptile/2.1/{type}/{mapID}/{variant}/{z}/{x}/{y}/{size}/{format}?app_id={app_id}&app_code={app_code}&lg={language}
- html_attribution
- Map © 1987-2023 HERE
- attribution
- Map (C) 1987-2023 HERE
- subdomains
- 1234
- mapID
- newest
- app_id
- app_code
- base
- traffic
- variant
- hybrid.traffic.day
- max_zoom
- 20
- type
- traffictile
- language
- eng
- format
- png8
- size
- 256
-
xyzservices.TileProviderHERE.pedestrianDay
- url
- https://{s}.{base}.maps.api.here.com/maptile/2.1/{type}/{mapID}/{variant}/{z}/{x}/{y}/{size}/{format}?app_id={app_id}&app_code={app_code}&lg={language}
- html_attribution
- Map © 1987-2023 HERE
- attribution
- Map (C) 1987-2023 HERE
- subdomains
- 1234
- mapID
- newest
- app_id
- app_code
- base
- base
- variant
- pedestrian.day
- max_zoom
- 20
- type
- maptile
- language
- eng
- format
- png8
- size
- 256
-
xyzservices.TileProviderHERE.pedestrianNight
- url
- https://{s}.{base}.maps.api.here.com/maptile/2.1/{type}/{mapID}/{variant}/{z}/{x}/{y}/{size}/{format}?app_id={app_id}&app_code={app_code}&lg={language}
- html_attribution
- Map © 1987-2023 HERE
- attribution
- Map (C) 1987-2023 HERE
- subdomains
- 1234
- mapID
- newest
- app_id
- app_code
- base
- base
- variant
- pedestrian.night
- max_zoom
- 20
- type
- maptile
- language
- eng
- format
- png8
- size
- 256
-
xyzservices.TileProviderHERE.satelliteDay
- url
- https://{s}.{base}.maps.api.here.com/maptile/2.1/{type}/{mapID}/{variant}/{z}/{x}/{y}/{size}/{format}?app_id={app_id}&app_code={app_code}&lg={language}
- html_attribution
- Map © 1987-2023 HERE
- attribution
- Map (C) 1987-2023 HERE
- subdomains
- 1234
- mapID
- newest
- app_id
- app_code
- base
- aerial
- variant
- satellite.day
- max_zoom
- 20
- type
- maptile
- language
- eng
- format
- png8
- size
- 256
-
xyzservices.TileProviderHERE.terrainDay
- url
- https://{s}.{base}.maps.api.here.com/maptile/2.1/{type}/{mapID}/{variant}/{z}/{x}/{y}/{size}/{format}?app_id={app_id}&app_code={app_code}&lg={language}
- html_attribution
- Map © 1987-2023 HERE
- attribution
- Map (C) 1987-2023 HERE
- subdomains
- 1234
- mapID
- newest
- app_id
- app_code
- base
- aerial
- variant
- terrain.day
- max_zoom
- 20
- type
- maptile
- language
- eng
- format
- png8
- size
- 256
-
xyzservices.TileProviderHERE.terrainDayMobile
- url
- https://{s}.{base}.maps.api.here.com/maptile/2.1/{type}/{mapID}/{variant}/{z}/{x}/{y}/{size}/{format}?app_id={app_id}&app_code={app_code}&lg={language}
- html_attribution
- Map © 1987-2023 HERE
- attribution
- Map (C) 1987-2023 HERE
- subdomains
- 1234
- mapID
- newest
- app_id
- app_code
- base
- aerial
- variant
- terrain.day.mobile
- max_zoom
- 20
- type
- maptile
- language
- eng
- format
- png8
- size
- 256
-
-
xyzservices.Bunch28 items
-
xyzservices.TileProviderHEREv3.normalDay
- url
- https://{s}.{base}.maps.ls.hereapi.com/maptile/2.1/{type}/{mapID}/{variant}/{z}/{x}/{y}/{size}/{format}?apiKey={apiKey}&lg={language}
- html_attribution
- Map © 1987-2023 HERE
- attribution
- Map (C) 1987-2023 HERE
- subdomains
- 1234
- mapID
- newest
- apiKey
- base
- base
- variant
- normal.day
- max_zoom
- 20
- type
- maptile
- language
- eng
- format
- png8
- size
- 256
-
xyzservices.TileProviderHEREv3.normalDayCustom
- url
- https://{s}.{base}.maps.ls.hereapi.com/maptile/2.1/{type}/{mapID}/{variant}/{z}/{x}/{y}/{size}/{format}?apiKey={apiKey}&lg={language}
- html_attribution
- Map © 1987-2023 HERE
- attribution
- Map (C) 1987-2023 HERE
- subdomains
- 1234
- mapID
- newest
- apiKey
- base
- base
- variant
- normal.day.custom
- max_zoom
- 20
- type
- maptile
- language
- eng
- format
- png8
- size
- 256
-
xyzservices.TileProviderHEREv3.normalDayGrey
- url
- https://{s}.{base}.maps.ls.hereapi.com/maptile/2.1/{type}/{mapID}/{variant}/{z}/{x}/{y}/{size}/{format}?apiKey={apiKey}&lg={language}
- html_attribution
- Map © 1987-2023 HERE
- attribution
- Map (C) 1987-2023 HERE
- subdomains
- 1234
- mapID
- newest
- apiKey
- base
- base
- variant
- normal.day.grey
- max_zoom
- 20
- type
- maptile
- language
- eng
- format
- png8
- size
- 256
-
xyzservices.TileProviderHEREv3.normalDayMobile
- url
- https://{s}.{base}.maps.ls.hereapi.com/maptile/2.1/{type}/{mapID}/{variant}/{z}/{x}/{y}/{size}/{format}?apiKey={apiKey}&lg={language}
- html_attribution
- Map © 1987-2023 HERE
- attribution
- Map (C) 1987-2023 HERE
- subdomains
- 1234
- mapID
- newest
- apiKey
- base
- base
- variant
- normal.day.mobile
- max_zoom
- 20
- type
- maptile
- language
- eng
- format
- png8
- size
- 256
-
xyzservices.TileProviderHEREv3.normalDayGreyMobile
- url
- https://{s}.{base}.maps.ls.hereapi.com/maptile/2.1/{type}/{mapID}/{variant}/{z}/{x}/{y}/{size}/{format}?apiKey={apiKey}&lg={language}
- html_attribution
- Map © 1987-2023 HERE
- attribution
- Map (C) 1987-2023 HERE
- subdomains
- 1234
- mapID
- newest
- apiKey
- base
- base
- variant
- normal.day.grey.mobile
- max_zoom
- 20
- type
- maptile
- language
- eng
- format
- png8
- size
- 256
-
xyzservices.TileProviderHEREv3.normalDayTransit
- url
- https://{s}.{base}.maps.ls.hereapi.com/maptile/2.1/{type}/{mapID}/{variant}/{z}/{x}/{y}/{size}/{format}?apiKey={apiKey}&lg={language}
- html_attribution
- Map © 1987-2023 HERE
- attribution
- Map (C) 1987-2023 HERE
- subdomains
- 1234
- mapID
- newest
- apiKey
- base
- base
- variant
- normal.day.transit
- max_zoom
- 20
- type
- maptile
- language
- eng
- format
- png8
- size
- 256
-
xyzservices.TileProviderHEREv3.normalDayTransitMobile
- url
- https://{s}.{base}.maps.ls.hereapi.com/maptile/2.1/{type}/{mapID}/{variant}/{z}/{x}/{y}/{size}/{format}?apiKey={apiKey}&lg={language}
- html_attribution
- Map © 1987-2023 HERE
- attribution
- Map (C) 1987-2023 HERE
- subdomains
- 1234
- mapID
- newest
- apiKey
- base
- base
- variant
- normal.day.transit.mobile
- max_zoom
- 20
- type
- maptile
- language
- eng
- format
- png8
- size
- 256
-
xyzservices.TileProviderHEREv3.normalNight
- url
- https://{s}.{base}.maps.ls.hereapi.com/maptile/2.1/{type}/{mapID}/{variant}/{z}/{x}/{y}/{size}/{format}?apiKey={apiKey}&lg={language}
- html_attribution
- Map © 1987-2023 HERE
- attribution
- Map (C) 1987-2023 HERE
- subdomains
- 1234
- mapID
- newest
- apiKey
- base
- base
- variant
- normal.night
- max_zoom
- 20
- type
- maptile
- language
- eng
- format
- png8
- size
- 256
-
xyzservices.TileProviderHEREv3.normalNightMobile
- url
- https://{s}.{base}.maps.ls.hereapi.com/maptile/2.1/{type}/{mapID}/{variant}/{z}/{x}/{y}/{size}/{format}?apiKey={apiKey}&lg={language}
- html_attribution
- Map © 1987-2023 HERE
- attribution
- Map (C) 1987-2023 HERE
- subdomains
- 1234
- mapID
- newest
- apiKey
- base
- base
- variant
- normal.night.mobile
- max_zoom
- 20
- type
- maptile
- language
- eng
- format
- png8
- size
- 256
-
xyzservices.TileProviderHEREv3.normalNightGrey
- url
- https://{s}.{base}.maps.ls.hereapi.com/maptile/2.1/{type}/{mapID}/{variant}/{z}/{x}/{y}/{size}/{format}?apiKey={apiKey}&lg={language}
- html_attribution
- Map © 1987-2023 HERE
- attribution
- Map (C) 1987-2023 HERE
- subdomains
- 1234
- mapID
- newest
- apiKey
- base
- base
- variant
- normal.night.grey
- max_zoom
- 20
- type
- maptile
- language
- eng
- format
- png8
- size
- 256
-
xyzservices.TileProviderHEREv3.normalNightGreyMobile
- url
- https://{s}.{base}.maps.ls.hereapi.com/maptile/2.1/{type}/{mapID}/{variant}/{z}/{x}/{y}/{size}/{format}?apiKey={apiKey}&lg={language}
- html_attribution
- Map © 1987-2023 HERE
- attribution
- Map (C) 1987-2023 HERE
- subdomains
- 1234
- mapID
- newest
- apiKey
- base
- base
- variant
- normal.night.grey.mobile
- max_zoom
- 20
- type
- maptile
- language
- eng
- format
- png8
- size
- 256
-
xyzservices.TileProviderHEREv3.normalNightTransit
- url
- https://{s}.{base}.maps.ls.hereapi.com/maptile/2.1/{type}/{mapID}/{variant}/{z}/{x}/{y}/{size}/{format}?apiKey={apiKey}&lg={language}
- html_attribution
- Map © 1987-2023 HERE
- attribution
- Map (C) 1987-2023 HERE
- subdomains
- 1234
- mapID
- newest
- apiKey
- base
- base
- variant
- normal.night.transit
- max_zoom
- 20
- type
- maptile
- language
- eng
- format
- png8
- size
- 256
-
xyzservices.TileProviderHEREv3.normalNightTransitMobile
- url
- https://{s}.{base}.maps.ls.hereapi.com/maptile/2.1/{type}/{mapID}/{variant}/{z}/{x}/{y}/{size}/{format}?apiKey={apiKey}&lg={language}
- html_attribution
- Map © 1987-2023 HERE
- attribution
- Map (C) 1987-2023 HERE
- subdomains
- 1234
- mapID
- newest
- apiKey
- base
- base
- variant
- normal.night.transit.mobile
- max_zoom
- 20
- type
- maptile
- language
- eng
- format
- png8
- size
- 256
-
xyzservices.TileProviderHEREv3.reducedDay
- url
- https://{s}.{base}.maps.ls.hereapi.com/maptile/2.1/{type}/{mapID}/{variant}/{z}/{x}/{y}/{size}/{format}?apiKey={apiKey}&lg={language}
- html_attribution
- Map © 1987-2023 HERE
- attribution
- Map (C) 1987-2023 HERE
- subdomains
- 1234
- mapID
- newest
- apiKey
- base
- base
- variant
- reduced.day
- max_zoom
- 20
- type
- maptile
- language
- eng
- format
- png8
- size
- 256
-
xyzservices.TileProviderHEREv3.reducedNight
- url
- https://{s}.{base}.maps.ls.hereapi.com/maptile/2.1/{type}/{mapID}/{variant}/{z}/{x}/{y}/{size}/{format}?apiKey={apiKey}&lg={language}
- html_attribution
- Map © 1987-2023 HERE
- attribution
- Map (C) 1987-2023 HERE
- subdomains
- 1234
- mapID
- newest
- apiKey
- base
- base
- variant
- reduced.night
- max_zoom
- 20
- type
- maptile
- language
- eng
- format
- png8
- size
- 256
-
xyzservices.TileProviderHEREv3.basicMap
- url
- https://{s}.{base}.maps.ls.hereapi.com/maptile/2.1/{type}/{mapID}/{variant}/{z}/{x}/{y}/{size}/{format}?apiKey={apiKey}&lg={language}
- html_attribution
- Map © 1987-2023 HERE
- attribution
- Map (C) 1987-2023 HERE
- subdomains
- 1234
- mapID
- newest
- apiKey
- base
- base
- variant
- normal.day
- max_zoom
- 20
- type
- basetile
- language
- eng
- format
- png8
- size
- 256
-
xyzservices.TileProviderHEREv3.mapLabels
- url
- https://{s}.{base}.maps.ls.hereapi.com/maptile/2.1/{type}/{mapID}/{variant}/{z}/{x}/{y}/{size}/{format}?apiKey={apiKey}&lg={language}
- html_attribution
- Map © 1987-2023 HERE
- attribution
- Map (C) 1987-2023 HERE
- subdomains
- 1234
- mapID
- newest
- apiKey
- base
- base
- variant
- normal.day
- max_zoom
- 20
- type
- labeltile
- language
- eng
- format
- png
- size
- 256
-
xyzservices.TileProviderHEREv3.trafficFlow
- url
- https://{s}.{base}.maps.ls.hereapi.com/maptile/2.1/{type}/{mapID}/{variant}/{z}/{x}/{y}/{size}/{format}?apiKey={apiKey}&lg={language}
- html_attribution
- Map © 1987-2023 HERE
- attribution
- Map (C) 1987-2023 HERE
- subdomains
- 1234
- mapID
- newest
- apiKey
- base
- traffic
- variant
- normal.day
- max_zoom
- 20
- type
- flowtile
- language
- eng
- format
- png8
- size
- 256
-
xyzservices.TileProviderHEREv3.carnavDayGrey
- url
- https://{s}.{base}.maps.ls.hereapi.com/maptile/2.1/{type}/{mapID}/{variant}/{z}/{x}/{y}/{size}/{format}?apiKey={apiKey}&lg={language}
- html_attribution
- Map © 1987-2023 HERE
- attribution
- Map (C) 1987-2023 HERE
- subdomains
- 1234
- mapID
- newest
- apiKey
- base
- base
- variant
- carnav.day.grey
- max_zoom
- 20
- type
- maptile
- language
- eng
- format
- png8
- size
- 256
-
xyzservices.TileProviderHEREv3.hybridDay
- url
- https://{s}.{base}.maps.ls.hereapi.com/maptile/2.1/{type}/{mapID}/{variant}/{z}/{x}/{y}/{size}/{format}?apiKey={apiKey}&lg={language}
- html_attribution
- Map © 1987-2023 HERE
- attribution
- Map (C) 1987-2023 HERE
- subdomains
- 1234
- mapID
- newest
- apiKey
- base
- aerial
- variant
- hybrid.day
- max_zoom
- 20
- type
- maptile
- language
- eng
- format
- png8
- size
- 256
-
xyzservices.TileProviderHEREv3.hybridDayMobile
- url
- https://{s}.{base}.maps.ls.hereapi.com/maptile/2.1/{type}/{mapID}/{variant}/{z}/{x}/{y}/{size}/{format}?apiKey={apiKey}&lg={language}
- html_attribution
- Map © 1987-2023 HERE
- attribution
- Map (C) 1987-2023 HERE
- subdomains
- 1234
- mapID
- newest
- apiKey
- base
- aerial
- variant
- hybrid.day.mobile
- max_zoom
- 20
- type
- maptile
- language
- eng
- format
- png8
- size
- 256
-
xyzservices.TileProviderHEREv3.hybridDayTransit
- url
- https://{s}.{base}.maps.ls.hereapi.com/maptile/2.1/{type}/{mapID}/{variant}/{z}/{x}/{y}/{size}/{format}?apiKey={apiKey}&lg={language}
- html_attribution
- Map © 1987-2023 HERE
- attribution
- Map (C) 1987-2023 HERE
- subdomains
- 1234
- mapID
- newest
- apiKey
- base
- aerial
- variant
- hybrid.day.transit
- max_zoom
- 20
- type
- maptile
- language
- eng
- format
- png8
- size
- 256
-
xyzservices.TileProviderHEREv3.hybridDayGrey
- url
- https://{s}.{base}.maps.ls.hereapi.com/maptile/2.1/{type}/{mapID}/{variant}/{z}/{x}/{y}/{size}/{format}?apiKey={apiKey}&lg={language}
- html_attribution
- Map © 1987-2023 HERE
- attribution
- Map (C) 1987-2023 HERE
- subdomains
- 1234
- mapID
- newest
- apiKey
- base
- aerial
- variant
- hybrid.grey.day
- max_zoom
- 20
- type
- maptile
- language
- eng
- format
- png8
- size
- 256
-
xyzservices.TileProviderHEREv3.pedestrianDay
- url
- https://{s}.{base}.maps.ls.hereapi.com/maptile/2.1/{type}/{mapID}/{variant}/{z}/{x}/{y}/{size}/{format}?apiKey={apiKey}&lg={language}
- html_attribution
- Map © 1987-2023 HERE
- attribution
- Map (C) 1987-2023 HERE
- subdomains
- 1234
- mapID
- newest
- apiKey
- base
- base
- variant
- pedestrian.day
- max_zoom
- 20
- type
- maptile
- language
- eng
- format
- png8
- size
- 256
-
xyzservices.TileProviderHEREv3.pedestrianNight
- url
- https://{s}.{base}.maps.ls.hereapi.com/maptile/2.1/{type}/{mapID}/{variant}/{z}/{x}/{y}/{size}/{format}?apiKey={apiKey}&lg={language}
- html_attribution
- Map © 1987-2023 HERE
- attribution
- Map (C) 1987-2023 HERE
- subdomains
- 1234
- mapID
- newest
- apiKey
- base
- base
- variant
- pedestrian.night
- max_zoom
- 20
- type
- maptile
- language
- eng
- format
- png8
- size
- 256
-
xyzservices.TileProviderHEREv3.satelliteDay
- url
- https://{s}.{base}.maps.ls.hereapi.com/maptile/2.1/{type}/{mapID}/{variant}/{z}/{x}/{y}/{size}/{format}?apiKey={apiKey}&lg={language}
- html_attribution
- Map © 1987-2023 HERE
- attribution
- Map (C) 1987-2023 HERE
- subdomains
- 1234
- mapID
- newest
- apiKey
- base
- aerial
- variant
- satellite.day
- max_zoom
- 20
- type
- maptile
- language
- eng
- format
- png8
- size
- 256
-
xyzservices.TileProviderHEREv3.terrainDay
- url
- https://{s}.{base}.maps.ls.hereapi.com/maptile/2.1/{type}/{mapID}/{variant}/{z}/{x}/{y}/{size}/{format}?apiKey={apiKey}&lg={language}
- html_attribution
- Map © 1987-2023 HERE
- attribution
- Map (C) 1987-2023 HERE
- subdomains
- 1234
- mapID
- newest
- apiKey
- base
- aerial
- variant
- terrain.day
- max_zoom
- 20
- type
- maptile
- language
- eng
- format
- png8
- size
- 256
-
xyzservices.TileProviderHEREv3.terrainDayMobile
- url
- https://{s}.{base}.maps.ls.hereapi.com/maptile/2.1/{type}/{mapID}/{variant}/{z}/{x}/{y}/{size}/{format}?apiKey={apiKey}&lg={language}
- html_attribution
- Map © 1987-2023 HERE
- attribution
- Map (C) 1987-2023 HERE
- subdomains
- 1234
- mapID
- newest
- apiKey
- base
- aerial
- variant
- terrain.day.mobile
- max_zoom
- 20
- type
- maptile
- language
- eng
- format
- png8
- size
- 256
-
-
xyzservices.TileProviderFreeMapSK
- url
- https://{s}.freemap.sk/T/{z}/{x}/{y}.jpeg
- min_zoom
- 8
- max_zoom
- 16
- subdomains
- abcd
- bounds
- [[47.204642, 15.996093], [49.830896, 22.576904]]
- html_attribution
- © OpenStreetMap contributors, visualization CC-By-SA 2.0 Freemap.sk
- attribution
- (C) OpenStreetMap contributors, visualization CC-By-SA 2.0 Freemap.sk
-
xyzservices.TileProviderMtbMap
- url
- http://tile.mtbmap.cz/mtbmap_tiles/{z}/{x}/{y}.png
- html_attribution
- © OpenStreetMap contributors & USGS
- attribution
- (C) OpenStreetMap contributors & USGS
-
xyzservices.Bunch10 items
-
xyzservices.TileProviderCartoDB.Positron
- url
- https://{s}.basemaps.cartocdn.com/{variant}/{z}/{x}/{y}{r}.png
- html_attribution
- © OpenStreetMap contributors © CARTO
- attribution
- (C) OpenStreetMap contributors (C) CARTO
- subdomains
- abcd
- max_zoom
- 20
- variant
- light_all
-
xyzservices.TileProviderCartoDB.PositronNoLabels
- url
- https://{s}.basemaps.cartocdn.com/{variant}/{z}/{x}/{y}{r}.png
- html_attribution
- © OpenStreetMap contributors © CARTO
- attribution
- (C) OpenStreetMap contributors (C) CARTO
- subdomains
- abcd
- max_zoom
- 20
- variant
- light_nolabels
-
xyzservices.TileProviderCartoDB.PositronOnlyLabels
- url
- https://{s}.basemaps.cartocdn.com/{variant}/{z}/{x}/{y}{r}.png
- html_attribution
- © OpenStreetMap contributors © CARTO
- attribution
- (C) OpenStreetMap contributors (C) CARTO
- subdomains
- abcd
- max_zoom
- 20
- variant
- light_only_labels
-
xyzservices.TileProviderCartoDB.DarkMatter
- url
- https://{s}.basemaps.cartocdn.com/{variant}/{z}/{x}/{y}{r}.png
- html_attribution
- © OpenStreetMap contributors © CARTO
- attribution
- (C) OpenStreetMap contributors (C) CARTO
- subdomains
- abcd
- max_zoom
- 20
- variant
- dark_all
-
xyzservices.TileProviderCartoDB.DarkMatterNoLabels
- url
- https://{s}.basemaps.cartocdn.com/{variant}/{z}/{x}/{y}{r}.png
- html_attribution
- © OpenStreetMap contributors © CARTO
- attribution
- (C) OpenStreetMap contributors (C) CARTO
- subdomains
- abcd
- max_zoom
- 20
- variant
- dark_nolabels
-
xyzservices.TileProviderCartoDB.DarkMatterOnlyLabels
- url
- https://{s}.basemaps.cartocdn.com/{variant}/{z}/{x}/{y}{r}.png
- html_attribution
- © OpenStreetMap contributors © CARTO
- attribution
- (C) OpenStreetMap contributors (C) CARTO
- subdomains
- abcd
- max_zoom
- 20
- variant
- dark_only_labels
-
xyzservices.TileProviderCartoDB.Voyager
- url
- https://{s}.basemaps.cartocdn.com/{variant}/{z}/{x}/{y}{r}.png
- html_attribution
- © OpenStreetMap contributors © CARTO
- attribution
- (C) OpenStreetMap contributors (C) CARTO
- subdomains
- abcd
- max_zoom
- 20
- variant
- rastertiles/voyager
-
xyzservices.TileProviderCartoDB.VoyagerNoLabels
- url
- https://{s}.basemaps.cartocdn.com/{variant}/{z}/{x}/{y}{r}.png
- html_attribution
- © OpenStreetMap contributors © CARTO
- attribution
- (C) OpenStreetMap contributors (C) CARTO
- subdomains
- abcd
- max_zoom
- 20
- variant
- rastertiles/voyager_nolabels
-
xyzservices.TileProviderCartoDB.VoyagerOnlyLabels
- url
- https://{s}.basemaps.cartocdn.com/{variant}/{z}/{x}/{y}{r}.png
- html_attribution
- © OpenStreetMap contributors © CARTO
- attribution
- (C) OpenStreetMap contributors (C) CARTO
- subdomains
- abcd
- max_zoom
- 20
- variant
- rastertiles/voyager_only_labels
-
xyzservices.TileProviderCartoDB.VoyagerLabelsUnder
- url
- https://{s}.basemaps.cartocdn.com/{variant}/{z}/{x}/{y}{r}.png
- html_attribution
- © OpenStreetMap contributors © CARTO
- attribution
- (C) OpenStreetMap contributors (C) CARTO
- subdomains
- abcd
- max_zoom
- 20
- variant
- rastertiles/voyager_labels_under
-
-
xyzservices.Bunch2 items
-
xyzservices.TileProviderHikeBike.HikeBike
- url
- https://tiles.wmflabs.org/{variant}/{z}/{x}/{y}.png
- max_zoom
- 19
- html_attribution
- © OpenStreetMap contributors
- attribution
- (C) OpenStreetMap contributors
- variant
- hikebike
-
xyzservices.TileProviderHikeBike.HillShading
- url
- https://tiles.wmflabs.org/{variant}/{z}/{x}/{y}.png
- max_zoom
- 15
- html_attribution
- © OpenStreetMap contributors
- attribution
- (C) OpenStreetMap contributors
- variant
- hillshading
-
-
xyzservices.Bunch7 items
-
xyzservices.TileProviderBasemapAT.basemap
- url
- https://mapsneu.wien.gv.at/basemap/{variant}/{type}/google3857/{z}/{y}/{x}.{format}
- max_zoom
- 20
- html_attribution
- Datenquelle: basemap.at
- attribution
- Datenquelle: basemap.at
- type
- normal
- format
- png
- bounds
- [[46.35877, 8.782379], [49.037872, 17.189532]]
- variant
- geolandbasemap
-
xyzservices.TileProviderBasemapAT.grau
- url
- https://mapsneu.wien.gv.at/basemap/{variant}/{type}/google3857/{z}/{y}/{x}.{format}
- max_zoom
- 19
- html_attribution
- Datenquelle: basemap.at
- attribution
- Datenquelle: basemap.at
- type
- normal
- format
- png
- bounds
- [[46.35877, 8.782379], [49.037872, 17.189532]]
- variant
- bmapgrau
-
xyzservices.TileProviderBasemapAT.overlay
- url
- https://mapsneu.wien.gv.at/basemap/{variant}/{type}/google3857/{z}/{y}/{x}.{format}
- max_zoom
- 19
- html_attribution
- Datenquelle: basemap.at
- attribution
- Datenquelle: basemap.at
- type
- normal
- format
- png
- bounds
- [[46.35877, 8.782379], [49.037872, 17.189532]]
- variant
- bmapoverlay
-
xyzservices.TileProviderBasemapAT.terrain
- url
- https://mapsneu.wien.gv.at/basemap/{variant}/{type}/google3857/{z}/{y}/{x}.{format}
- max_zoom
- 19
- html_attribution
- Datenquelle: basemap.at
- attribution
- Datenquelle: basemap.at
- type
- grau
- format
- jpeg
- bounds
- [[46.35877, 8.782379], [49.037872, 17.189532]]
- variant
- bmapgelaende
-
xyzservices.TileProviderBasemapAT.surface
- url
- https://mapsneu.wien.gv.at/basemap/{variant}/{type}/google3857/{z}/{y}/{x}.{format}
- max_zoom
- 19
- html_attribution
- Datenquelle: basemap.at
- attribution
- Datenquelle: basemap.at
- type
- grau
- format
- jpeg
- bounds
- [[46.35877, 8.782379], [49.037872, 17.189532]]
- variant
- bmapoberflaeche
-
xyzservices.TileProviderBasemapAT.highdpi
- url
- https://mapsneu.wien.gv.at/basemap/{variant}/{type}/google3857/{z}/{y}/{x}.{format}
- max_zoom
- 19
- html_attribution
- Datenquelle: basemap.at
- attribution
- Datenquelle: basemap.at
- type
- normal
- format
- jpeg
- bounds
- [[46.35877, 8.782379], [49.037872, 17.189532]]
- variant
- bmaphidpi
-
xyzservices.TileProviderBasemapAT.orthofoto
- url
- https://mapsneu.wien.gv.at/basemap/{variant}/{type}/google3857/{z}/{y}/{x}.{format}
- max_zoom
- 20
- html_attribution
- Datenquelle: basemap.at
- attribution
- Datenquelle: basemap.at
- type
- normal
- format
- jpeg
- bounds
- [[46.35877, 8.782379], [49.037872, 17.189532]]
- variant
- bmaporthofoto30cm
-
-
xyzservices.Bunch5 items
-
xyzservices.TileProvidernlmaps.standaard
- url
- https://service.pdok.nl/brt/achtergrondkaart/wmts/v2_0/{variant}/EPSG:3857/{z}/{x}/{y}.png
- min_zoom
- 6
- max_zoom
- 19
- bounds
- [[50.5, 3.25], [54, 7.6]]
- html_attribution
- Kaartgegevens © Kadaster
- attribution
- Kaartgegevens (C) Kadaster
- variant
- standaard
-
xyzservices.TileProvidernlmaps.pastel
- url
- https://service.pdok.nl/brt/achtergrondkaart/wmts/v2_0/{variant}/EPSG:3857/{z}/{x}/{y}.png
- min_zoom
- 6
- max_zoom
- 19
- bounds
- [[50.5, 3.25], [54, 7.6]]
- html_attribution
- Kaartgegevens © Kadaster
- attribution
- Kaartgegevens (C) Kadaster
- variant
- pastel
-
xyzservices.TileProvidernlmaps.grijs
- url
- https://service.pdok.nl/brt/achtergrondkaart/wmts/v2_0/{variant}/EPSG:3857/{z}/{x}/{y}.png
- min_zoom
- 6
- max_zoom
- 19
- bounds
- [[50.5, 3.25], [54, 7.6]]
- html_attribution
- Kaartgegevens © Kadaster
- attribution
- Kaartgegevens (C) Kadaster
- variant
- grijs
-
xyzservices.TileProvidernlmaps.water
- url
- https://service.pdok.nl/brt/achtergrondkaart/wmts/v2_0/{variant}/EPSG:3857/{z}/{x}/{y}.png
- min_zoom
- 6
- max_zoom
- 19
- bounds
- [[50.5, 3.25], [54, 7.6]]
- html_attribution
- Kaartgegevens © Kadaster
- attribution
- Kaartgegevens (C) Kadaster
- variant
- water
-
xyzservices.TileProvidernlmaps.luchtfoto
- url
- https://service.pdok.nl/hwh/luchtfotorgb/wmts/v1_0/Actueel_ortho25/EPSG:3857/{z}/{x}/{y}.jpeg
- min_zoom
- 6
- max_zoom
- 19
- bounds
- [[50.5, 3.25], [54, 7.6]]
- html_attribution
- Kaartgegevens © Kadaster
- attribution
- Kaartgegevens (C) Kadaster
-
-
xyzservices.Bunch15 items
-
xyzservices.TileProviderNASAGIBS.ModisTerraTrueColorCR
- url
- https://map1.vis.earthdata.nasa.gov/wmts-webmerc/{variant}/default/{time}/{tilematrixset}{max_zoom}/{z}/{y}/{x}.{format}
- html_attribution
- Imagery provided by services from the Global Imagery Browse Services (GIBS), operated by the NASA/GSFC/Earth Science Data and Information System (ESDIS) with funding provided by NASA/HQ.
- attribution
- Imagery provided by services from the Global Imagery Browse Services (GIBS), operated by the NASA/GSFC/Earth Science Data and Information System (ESDIS) with funding provided by NASA/HQ.
- bounds
- [[-85.0511287776, -179.999999975], [85.0511287776, 179.999999975]]
- min_zoom
- 1
- max_zoom
- 9
- format
- jpg
- time
- tilematrixset
- GoogleMapsCompatible_Level
- variant
- MODIS_Terra_CorrectedReflectance_TrueColor
-
xyzservices.TileProviderNASAGIBS.ModisTerraBands367CR
- url
- https://map1.vis.earthdata.nasa.gov/wmts-webmerc/{variant}/default/{time}/{tilematrixset}{max_zoom}/{z}/{y}/{x}.{format}
- html_attribution
- Imagery provided by services from the Global Imagery Browse Services (GIBS), operated by the NASA/GSFC/Earth Science Data and Information System (ESDIS) with funding provided by NASA/HQ.
- attribution
- Imagery provided by services from the Global Imagery Browse Services (GIBS), operated by the NASA/GSFC/Earth Science Data and Information System (ESDIS) with funding provided by NASA/HQ.
- bounds
- [[-85.0511287776, -179.999999975], [85.0511287776, 179.999999975]]
- min_zoom
- 1
- max_zoom
- 9
- format
- jpg
- time
- tilematrixset
- GoogleMapsCompatible_Level
- variant
- MODIS_Terra_CorrectedReflectance_Bands367
-
xyzservices.TileProviderNASAGIBS.ViirsEarthAtNight2012
- url
- https://map1.vis.earthdata.nasa.gov/wmts-webmerc/{variant}/default/{time}/{tilematrixset}{max_zoom}/{z}/{y}/{x}.{format}
- html_attribution
- Imagery provided by services from the Global Imagery Browse Services (GIBS), operated by the NASA/GSFC/Earth Science Data and Information System (ESDIS) with funding provided by NASA/HQ.
- attribution
- Imagery provided by services from the Global Imagery Browse Services (GIBS), operated by the NASA/GSFC/Earth Science Data and Information System (ESDIS) with funding provided by NASA/HQ.
- bounds
- [[-85.0511287776, -179.999999975], [85.0511287776, 179.999999975]]
- min_zoom
- 1
- max_zoom
- 8
- format
- jpg
- time
- tilematrixset
- GoogleMapsCompatible_Level
- variant
- VIIRS_CityLights_2012
-
xyzservices.TileProviderNASAGIBS.ModisTerraLSTDay
- url
- https://map1.vis.earthdata.nasa.gov/wmts-webmerc/{variant}/default/{time}/{tilematrixset}{max_zoom}/{z}/{y}/{x}.{format}
- html_attribution
- Imagery provided by services from the Global Imagery Browse Services (GIBS), operated by the NASA/GSFC/Earth Science Data and Information System (ESDIS) with funding provided by NASA/HQ.
- attribution
- Imagery provided by services from the Global Imagery Browse Services (GIBS), operated by the NASA/GSFC/Earth Science Data and Information System (ESDIS) with funding provided by NASA/HQ.
- bounds
- [[-85.0511287776, -179.999999975], [85.0511287776, 179.999999975]]
- min_zoom
- 1
- max_zoom
- 7
- format
- png
- time
- tilematrixset
- GoogleMapsCompatible_Level
- variant
- MODIS_Terra_Land_Surface_Temp_Day
- opacity
- 0.75
-
xyzservices.TileProviderNASAGIBS.ModisTerraSnowCover
- url
- https://map1.vis.earthdata.nasa.gov/wmts-webmerc/{variant}/default/{time}/{tilematrixset}{max_zoom}/{z}/{y}/{x}.{format}
- html_attribution
- Imagery provided by services from the Global Imagery Browse Services (GIBS), operated by the NASA/GSFC/Earth Science Data and Information System (ESDIS) with funding provided by NASA/HQ.
- attribution
- Imagery provided by services from the Global Imagery Browse Services (GIBS), operated by the NASA/GSFC/Earth Science Data and Information System (ESDIS) with funding provided by NASA/HQ.
- bounds
- [[-85.0511287776, -179.999999975], [85.0511287776, 179.999999975]]
- min_zoom
- 1
- max_zoom
- 8
- format
- png
- time
- tilematrixset
- GoogleMapsCompatible_Level
- variant
- MODIS_Terra_NDSI_Snow_Cover
- opacity
- 0.75
-
xyzservices.TileProviderNASAGIBS.ModisTerraAOD
- url
- https://map1.vis.earthdata.nasa.gov/wmts-webmerc/{variant}/default/{time}/{tilematrixset}{max_zoom}/{z}/{y}/{x}.{format}
- html_attribution
- Imagery provided by services from the Global Imagery Browse Services (GIBS), operated by the NASA/GSFC/Earth Science Data and Information System (ESDIS) with funding provided by NASA/HQ.
- attribution
- Imagery provided by services from the Global Imagery Browse Services (GIBS), operated by the NASA/GSFC/Earth Science Data and Information System (ESDIS) with funding provided by NASA/HQ.
- bounds
- [[-85.0511287776, -179.999999975], [85.0511287776, 179.999999975]]
- min_zoom
- 1
- max_zoom
- 6
- format
- png
- time
- tilematrixset
- GoogleMapsCompatible_Level
- variant
- MODIS_Terra_Aerosol
- opacity
- 0.75
-
xyzservices.TileProviderNASAGIBS.ModisTerraChlorophyll
- url
- https://map1.vis.earthdata.nasa.gov/wmts-webmerc/{variant}/default/{time}/{tilematrixset}{max_zoom}/{z}/{y}/{x}.{format}
- html_attribution
- Imagery provided by services from the Global Imagery Browse Services (GIBS), operated by the NASA/GSFC/Earth Science Data and Information System (ESDIS) with funding provided by NASA/HQ.
- attribution
- Imagery provided by services from the Global Imagery Browse Services (GIBS), operated by the NASA/GSFC/Earth Science Data and Information System (ESDIS) with funding provided by NASA/HQ.
- bounds
- [[-85.0511287776, -179.999999975], [85.0511287776, 179.999999975]]
- min_zoom
- 1
- max_zoom
- 7
- format
- png
- time
- tilematrixset
- GoogleMapsCompatible_Level
- variant
- MODIS_Terra_Chlorophyll_A
- opacity
- 0.75
-
xyzservices.TileProviderNASAGIBS.ModisTerraBands721CR
- url
- https://gibs.earthdata.nasa.gov/wmts/epsg3857/best/MODIS_Terra_CorrectedReflectance_Bands721/default/{time}/GoogleMapsCompatible_Level9/{z}/{y}/{x}.jpg
- max_zoom
- 9
- attribution
- Imagery provided by services from the Global Imagery Browse Services (GIBS), operated by the NASA/GSFC/Earth Science Data and Information System (ESDIS) with funding provided by NASA/HQ.
- html_attribution
- Imagery provided by services from the Global Imagery Browse Services (GIBS), operated by the NASA/GSFC/Earth Science Data and Information System (ESDIS) with funding provided by NASA/HQ.
- time
-
xyzservices.TileProviderNASAGIBS.ModisAquaTrueColorCR
- url
- https://gibs.earthdata.nasa.gov/wmts/epsg3857/best/MODIS_Aqua_CorrectedReflectance_TrueColor/default/{time}/GoogleMapsCompatible_Level9/{z}/{y}/{x}.jpg
- max_zoom
- 9
- attribution
- Imagery provided by services from the Global Imagery Browse Services (GIBS), operated by the NASA/GSFC/Earth Science Data and Information System (ESDIS) with funding provided by NASA/HQ.
- html_attribution
- Imagery provided by services from the Global Imagery Browse Services (GIBS), operated by the NASA/GSFC/Earth Science Data and Information System (ESDIS) with funding provided by NASA/HQ.
- time
-
xyzservices.TileProviderNASAGIBS.ModisAquaBands721CR
- url
- https://gibs.earthdata.nasa.gov/wmts/epsg3857/best/MODIS_Aqua_CorrectedReflectance_Bands721/default/{time}/GoogleMapsCompatible_Level9/{z}/{y}/{x}.jpg
- max_zoom
- 9
- attribution
- Imagery provided by services from the Global Imagery Browse Services (GIBS), operated by the NASA/GSFC/Earth Science Data and Information System (ESDIS) with funding provided by NASA/HQ.
- html_attribution
- Imagery provided by services from the Global Imagery Browse Services (GIBS), operated by the NASA/GSFC/Earth Science Data and Information System (ESDIS) with funding provided by NASA/HQ.
- time
-
xyzservices.TileProviderNASAGIBS.ViirsTrueColorCR
- url
- https://gibs.earthdata.nasa.gov/wmts/epsg3857/best/VIIRS_SNPP_CorrectedReflectance_TrueColor/default/{time}/GoogleMapsCompatible_Level9/{z}/{y}/{x}.jpg
- max_zoom
- 9
- attribution
- Imagery provided by services from the Global Imagery Browse Services (GIBS), operated by the NASA/GSFC/Earth Science Data and Information System (ESDIS) with funding provided by NASA/HQ.
- html_attribution
- Imagery provided by services from the Global Imagery Browse Services (GIBS), operated by the NASA/GSFC/Earth Science Data and Information System (ESDIS) with funding provided by NASA/HQ.
- time
-
xyzservices.TileProviderNASAGIBS.BlueMarble3413
- url
- https://gibs.earthdata.nasa.gov/wmts/epsg3413/best/BlueMarble_NextGeneration/default/EPSG3413_500m/{z}/{y}/{x}.jpeg
- max_zoom
- 5
- attribution
- Imagery provided by services from the Global Imagery Browse Services (GIBS), operated by the NASA/GSFC/Earth Science Data and Information System (ESDIS) with funding provided by NASA/HQ.
- html_attribution
- Imagery provided by services from the Global Imagery Browse Services (GIBS), operated by the NASA/GSFC/Earth Science Data and Information System (ESDIS) with funding provided by NASA/HQ.
- crs
- EPSG:3413
-
xyzservices.TileProviderNASAGIBS.BlueMarble3031
- url
- https://gibs.earthdata.nasa.gov/wmts/epsg3031/best/BlueMarble_NextGeneration/default/EPSG3031_500m/{z}/{y}/{x}.jpeg
- max_zoom
- 5
- attribution
- Imagery provided by services from the Global Imagery Browse Services (GIBS), operated by the NASA/GSFC/Earth Science Data and Information System (ESDIS) with funding provided by NASA/HQ.
- html_attribution
- Imagery provided by services from the Global Imagery Browse Services (GIBS), operated by the NASA/GSFC/Earth Science Data and Information System (ESDIS) with funding provided by NASA/HQ.
- crs
- EPSG:3031
-
xyzservices.TileProviderNASAGIBS.BlueMarble
- url
- https://gibs.earthdata.nasa.gov/wmts/epsg3857/best/BlueMarble_NextGeneration/default/EPSG3857_500m/{z}/{y}/{x}.jpeg
- max_zoom
- 8
- attribution
- Imagery provided by services from the Global Imagery Browse Services (GIBS), operated by the NASA/GSFC/Earth Science Data and Information System (ESDIS) with funding provided by NASA/HQ.
- html_attribution
- Imagery provided by services from the Global Imagery Browse Services (GIBS), operated by the NASA/GSFC/Earth Science Data and Information System (ESDIS) with funding provided by NASA/HQ.
-
xyzservices.TileProviderNASAGIBS.ASTER_GDEM_Greyscale_Shaded_Relief
- url
- https://gibs.earthdata.nasa.gov/wmts/epsg3857/best/ASTER_GDEM_Greyscale_Shaded_Relief/default/GoogleMapsCompatible_Level12/{z}/{y}/{x}.jpg
- max_zoom
- 12
- attribution
- Imagery provided by services from the Global Imagery Browse Services (GIBS), operated by the NASA/GSFC/Earth Science Data and Information System (ESDIS) with funding provided by NASA/HQ.
- html_attribution
- Imagery provided by services from the Global Imagery Browse Services (GIBS), operated by the NASA/GSFC/Earth Science Data and Information System (ESDIS) with funding provided by NASA/HQ.
-
-
xyzservices.TileProviderNLS
- url
- https://nls-{s}.tileserver.com/nls/{z}/{x}/{y}.jpg
- html_attribution
- National Library of Scotland Historic Maps
- attribution
- National Library of Scotland Historic Maps
- bounds
- [[49.6, -12], [61.7, 3]]
- min_zoom
- 1
- max_zoom
- 18
- subdomains
- 0123
- status
- broken
-
xyzservices.Bunch9 items
-
xyzservices.TileProviderJusticeMap.income
- url
- https://www.justicemap.org/tile/{size}/{variant}/{z}/{x}/{y}.png
- html_attribution
- Justice Map
- attribution
- Justice Map
- size
- county
- bounds
- [[14, -180], [72, -56]]
- variant
- income
-
xyzservices.TileProviderJusticeMap.americanIndian
- url
- https://www.justicemap.org/tile/{size}/{variant}/{z}/{x}/{y}.png
- html_attribution
- Justice Map
- attribution
- Justice Map
- size
- county
- bounds
- [[14, -180], [72, -56]]
- variant
- indian
-
xyzservices.TileProviderJusticeMap.asian
- url
- https://www.justicemap.org/tile/{size}/{variant}/{z}/{x}/{y}.png
- html_attribution
- Justice Map
- attribution
- Justice Map
- size
- county
- bounds
- [[14, -180], [72, -56]]
- variant
- asian
-
xyzservices.TileProviderJusticeMap.black
- url
- https://www.justicemap.org/tile/{size}/{variant}/{z}/{x}/{y}.png
- html_attribution
- Justice Map
- attribution
- Justice Map
- size
- county
- bounds
- [[14, -180], [72, -56]]
- variant
- black
-
xyzservices.TileProviderJusticeMap.hispanic
- url
- https://www.justicemap.org/tile/{size}/{variant}/{z}/{x}/{y}.png
- html_attribution
- Justice Map
- attribution
- Justice Map
- size
- county
- bounds
- [[14, -180], [72, -56]]
- variant
- hispanic
-
xyzservices.TileProviderJusticeMap.multi
- url
- https://www.justicemap.org/tile/{size}/{variant}/{z}/{x}/{y}.png
- html_attribution
- Justice Map
- attribution
- Justice Map
- size
- county
- bounds
- [[14, -180], [72, -56]]
- variant
- multi
-
xyzservices.TileProviderJusticeMap.nonWhite
- url
- https://www.justicemap.org/tile/{size}/{variant}/{z}/{x}/{y}.png
- html_attribution
- Justice Map
- attribution
- Justice Map
- size
- county
- bounds
- [[14, -180], [72, -56]]
- variant
- nonwhite
-
xyzservices.TileProviderJusticeMap.white
- url
- https://www.justicemap.org/tile/{size}/{variant}/{z}/{x}/{y}.png
- html_attribution
- Justice Map
- attribution
- Justice Map
- size
- county
- bounds
- [[14, -180], [72, -56]]
- variant
- white
-
xyzservices.TileProviderJusticeMap.plurality
- url
- https://www.justicemap.org/tile/{size}/{variant}/{z}/{x}/{y}.png
- html_attribution
- Justice Map
- attribution
- Justice Map
- size
- county
- bounds
- [[14, -180], [72, -56]]
- variant
- plural
-
-
xyzservices.Bunch271 items
-
xyzservices.TileProviderGeoportailFrance.plan
- url
- https://wxs.ign.fr/{apikey}/geoportail/wmts?REQUEST=GetTile&SERVICE=WMTS&VERSION=1.0.0&STYLE={style}&TILEMATRIXSET={TileMatrixSet}&FORMAT={format}&LAYER={variant}&TILEMATRIX={z}&TILEROW={y}&TILECOL={x}
- html_attribution
- Geoportail France
- attribution
- Geoportail France
- bounds
- [[-85.0, -175.0], [85.0, 175.0]]
- min_zoom
- 0
- max_zoom
- 19
- apikey
- essentiels
- format
- image/png
- style
- normal
- variant
- GEOGRAPHICALGRIDSYSTEMS.PLANIGNV2
- TileMatrixSet
- PM
-
xyzservices.TileProviderGeoportailFrance.parcels
- url
- https://wxs.ign.fr/{apikey}/geoportail/wmts?REQUEST=GetTile&SERVICE=WMTS&VERSION=1.0.0&STYLE={style}&TILEMATRIXSET={TileMatrixSet}&FORMAT={format}&LAYER={variant}&TILEMATRIX={z}&TILEROW={y}&TILECOL={x}
- html_attribution
- Geoportail France
- attribution
- Geoportail France
- bounds
- [[-21.4756, -63.3725], [51.3121, 55.9259]]
- min_zoom
- 0
- max_zoom
- 19
- apikey
- essentiels
- format
- image/png
- style
- normal
- variant
- CADASTRALPARCELS.PARCELLAIRE_EXPRESS
- TileMatrixSet
- PM
-
xyzservices.TileProviderGeoportailFrance.orthos
- url
- https://wxs.ign.fr/{apikey}/geoportail/wmts?REQUEST=GetTile&SERVICE=WMTS&VERSION=1.0.0&STYLE={style}&TILEMATRIXSET={TileMatrixSet}&FORMAT={format}&LAYER={variant}&TILEMATRIX={z}&TILEROW={y}&TILECOL={x}
- html_attribution
- Geoportail France
- attribution
- Geoportail France
- bounds
- [[-75.0, -179.5], [75.0, 179.5]]
- min_zoom
- 0
- max_zoom
- 21
- apikey
- ortho
- format
- image/jpeg
- style
- normal
- variant
- ORTHOIMAGERY.ORTHOPHOTOS
- TileMatrixSet
- PM
-
xyzservices.TileProviderGeoportailFrance.Adminexpress_cog_carto_Latest
- url
- https://wxs.ign.fr/{apikey}/geoportail/wmts?REQUEST=GetTile&SERVICE=WMTS&VERSION=1.0.0&STYLE={style}&TILEMATRIXSET={TileMatrixSet}&FORMAT={format}&LAYER={variant}&TILEMATRIX={z}&TILEROW={y}&TILECOL={x}
- html_attribution
- Geoportail France
- attribution
- Geoportail France
- bounds
- [[-21.4756, -63.3725], [51.3121, 55.9259]]
- min_zoom
- 6
- max_zoom
- 16
- apikey
- administratif
- format
- image/png
- style
- normal
- variant
- ADMINEXPRESS-COG-CARTO.LATEST
- TileMatrixSet
- PM
-
xyzservices.TileProviderGeoportailFrance.Adminexpress_cog_Latest
- url
- https://wxs.ign.fr/{apikey}/geoportail/wmts?REQUEST=GetTile&SERVICE=WMTS&VERSION=1.0.0&STYLE={style}&TILEMATRIXSET={TileMatrixSet}&FORMAT={format}&LAYER={variant}&TILEMATRIX={z}&TILEROW={y}&TILECOL={x}
- html_attribution
- Geoportail France
- attribution
- Geoportail France
- bounds
- [[-21.4756, -63.3725], [51.3121, 55.9259]]
- min_zoom
- 6
- max_zoom
- 16
- apikey
- administratif
- format
- image/png
- style
- normal
- variant
- ADMINEXPRESS-COG.LATEST
- TileMatrixSet
- PM
-
xyzservices.TileProviderGeoportailFrance.Limites_administratives_express_Latest
- url
- https://wxs.ign.fr/{apikey}/geoportail/wmts?REQUEST=GetTile&SERVICE=WMTS&VERSION=1.0.0&STYLE={style}&TILEMATRIXSET={TileMatrixSet}&FORMAT={format}&LAYER={variant}&TILEMATRIX={z}&TILEROW={y}&TILECOL={x}
- html_attribution
- Geoportail France
- attribution
- Geoportail France
- bounds
- [[-21.4756, -63.3725], [51.3121, 55.9259]]
- min_zoom
- 6
- max_zoom
- 16
- apikey
- administratif
- format
- image/png
- style
- normal
- variant
- LIMITES_ADMINISTRATIVES_EXPRESS.LATEST
- TileMatrixSet
- PM
-
xyzservices.TileProviderGeoportailFrance.Geographicalgridsystems_Slopes_Pac
- url
- https://wxs.ign.fr/{apikey}/geoportail/wmts?REQUEST=GetTile&SERVICE=WMTS&VERSION=1.0.0&STYLE={style}&TILEMATRIXSET={TileMatrixSet}&FORMAT={format}&LAYER={variant}&TILEMATRIX={z}&TILEROW={y}&TILECOL={x}
- html_attribution
- Geoportail France
- attribution
- Geoportail France
- bounds
- [[-21.5446, -63.1614], [51.0991, 56.0018]]
- min_zoom
- 0
- max_zoom
- 15
- apikey
- agriculture
- format
- image/png
- style
- normal
- variant
- GEOGRAPHICALGRIDSYSTEMS.SLOPES.PAC
- TileMatrixSet
- PM
-
xyzservices.TileProviderGeoportailFrance.Hydrography_Bcae_Latest
- url
- https://wxs.ign.fr/{apikey}/geoportail/wmts?REQUEST=GetTile&SERVICE=WMTS&VERSION=1.0.0&STYLE={style}&TILEMATRIXSET={TileMatrixSet}&FORMAT={format}&LAYER={variant}&TILEMATRIX={z}&TILEROW={y}&TILECOL={x}
- html_attribution
- Geoportail France
- attribution
- Geoportail France
- bounds
- [[41.3252, -5.15047], [51.0991, 9.57054]]
- min_zoom
- 6
- max_zoom
- 17
- apikey
- agriculture
- format
- image/png
- style
- normal
- variant
- HYDROGRAPHY.BCAE.LATEST
- TileMatrixSet
- PM
-
xyzservices.TileProviderGeoportailFrance.Landuse_Agriculture_Latest
- url
- https://wxs.ign.fr/{apikey}/geoportail/wmts?REQUEST=GetTile&SERVICE=WMTS&VERSION=1.0.0&STYLE={style}&TILEMATRIXSET={TileMatrixSet}&FORMAT={format}&LAYER={variant}&TILEMATRIX={z}&TILEROW={y}&TILECOL={x}
- html_attribution
- Geoportail France
- attribution
- Geoportail France
- bounds
- [[-21.4756, -63.3725], [51.3121, 55.9259]]
- min_zoom
- 6
- max_zoom
- 16
- apikey
- agriculture
- format
- image/png
- style
- normal
- variant
- LANDUSE.AGRICULTURE.LATEST
- TileMatrixSet
- PM
-
xyzservices.TileProviderGeoportailFrance.Landuse_Agriculture2007
- url
- https://wxs.ign.fr/{apikey}/geoportail/wmts?REQUEST=GetTile&SERVICE=WMTS&VERSION=1.0.0&STYLE={style}&TILEMATRIXSET={TileMatrixSet}&FORMAT={format}&LAYER={variant}&TILEMATRIX={z}&TILEROW={y}&TILECOL={x}
- html_attribution
- Geoportail France
- attribution
- Geoportail France
- bounds
- [[-21.419, -63.2635], [51.2203, 56.0237]]
- min_zoom
- 6
- max_zoom
- 16
- apikey
- agriculture
- format
- image/png
- style
- normal
- variant
- LANDUSE.AGRICULTURE2007
- TileMatrixSet
- PM
-
xyzservices.TileProviderGeoportailFrance.Landuse_Agriculture2008
- url
- https://wxs.ign.fr/{apikey}/geoportail/wmts?REQUEST=GetTile&SERVICE=WMTS&VERSION=1.0.0&STYLE={style}&TILEMATRIXSET={TileMatrixSet}&FORMAT={format}&LAYER={variant}&TILEMATRIX={z}&TILEROW={y}&TILECOL={x}
- html_attribution
- Geoportail France
- attribution
- Geoportail France
- bounds
- [[-21.419, -63.2635], [51.2203, 56.0237]]
- min_zoom
- 6
- max_zoom
- 16
- apikey
- agriculture
- format
- image/png
- style
- normal
- variant
- LANDUSE.AGRICULTURE2008
- TileMatrixSet
- PM
-
xyzservices.TileProviderGeoportailFrance.Landuse_Agriculture2009
- url
- https://wxs.ign.fr/{apikey}/geoportail/wmts?REQUEST=GetTile&SERVICE=WMTS&VERSION=1.0.0&STYLE={style}&TILEMATRIXSET={TileMatrixSet}&FORMAT={format}&LAYER={variant}&TILEMATRIX={z}&TILEROW={y}&TILECOL={x}
- html_attribution
- Geoportail France
- attribution
- Geoportail France
- bounds
- [[-21.419, -63.2635], [51.2203, 56.0237]]
- min_zoom
- 6
- max_zoom
- 16
- apikey
- agriculture
- format
- image/png
- style
- normal
- variant
- LANDUSE.AGRICULTURE2009
- TileMatrixSet
- PM
-
xyzservices.TileProviderGeoportailFrance.Landuse_Agriculture2010
- url
- https://wxs.ign.fr/{apikey}/geoportail/wmts?REQUEST=GetTile&SERVICE=WMTS&VERSION=1.0.0&STYLE={style}&TILEMATRIXSET={TileMatrixSet}&FORMAT={format}&LAYER={variant}&TILEMATRIX={z}&TILEROW={y}&TILECOL={x}
- html_attribution
- Geoportail France
- attribution
- Geoportail France
- bounds
- [[-21.4756, -63.3725], [51.3121, 55.9259]]
- min_zoom
- 6
- max_zoom
- 16
- apikey
- agriculture
- format
- image/png
- style
- normal
- variant
- LANDUSE.AGRICULTURE2010
- TileMatrixSet
- PM
-
xyzservices.TileProviderGeoportailFrance.Landuse_Agriculture2011
- url
- https://wxs.ign.fr/{apikey}/geoportail/wmts?REQUEST=GetTile&SERVICE=WMTS&VERSION=1.0.0&STYLE={style}&TILEMATRIXSET={TileMatrixSet}&FORMAT={format}&LAYER={variant}&TILEMATRIX={z}&TILEROW={y}&TILECOL={x}
- html_attribution
- Geoportail France
- attribution
- Geoportail France
- bounds
- [[-21.4756, -63.3725], [51.3121, 55.9259]]
- min_zoom
- 6
- max_zoom
- 16
- apikey
- agriculture
- format
- image/png
- style
- normal
- variant
- LANDUSE.AGRICULTURE2011
- TileMatrixSet
- PM
-
xyzservices.TileProviderGeoportailFrance.Landuse_Agriculture2012
- url
- https://wxs.ign.fr/{apikey}/geoportail/wmts?REQUEST=GetTile&SERVICE=WMTS&VERSION=1.0.0&STYLE={style}&TILEMATRIXSET={TileMatrixSet}&FORMAT={format}&LAYER={variant}&TILEMATRIX={z}&TILEROW={y}&TILECOL={x}
- html_attribution
- Geoportail France
- attribution
- Geoportail France
- bounds
- [[-21.4756, -63.3725], [51.3121, 55.9259]]
- min_zoom
- 0
- max_zoom
- 16
- apikey
- agriculture
- format
- image/png
- style
- normal
- variant
- LANDUSE.AGRICULTURE2012
- TileMatrixSet
- PM
-
xyzservices.TileProviderGeoportailFrance.Landuse_Agriculture2013
- url
- https://wxs.ign.fr/{apikey}/geoportail/wmts?REQUEST=GetTile&SERVICE=WMTS&VERSION=1.0.0&STYLE={style}&TILEMATRIXSET={TileMatrixSet}&FORMAT={format}&LAYER={variant}&TILEMATRIX={z}&TILEROW={y}&TILECOL={x}
- html_attribution
- Geoportail France
- attribution
- Geoportail France
- bounds
- [[-21.4756, -63.3725], [51.3121, 55.9259]]
- min_zoom
- 0
- max_zoom
- 16
- apikey
- agriculture
- format
- image/png
- style
- normal
- variant
- LANDUSE.AGRICULTURE2013
- TileMatrixSet
- PM
-
xyzservices.TileProviderGeoportailFrance.Landuse_Agriculture2014
- url
- https://wxs.ign.fr/{apikey}/geoportail/wmts?REQUEST=GetTile&SERVICE=WMTS&VERSION=1.0.0&STYLE={style}&TILEMATRIXSET={TileMatrixSet}&FORMAT={format}&LAYER={variant}&TILEMATRIX={z}&TILEROW={y}&TILECOL={x}
- html_attribution
- Geoportail France
- attribution
- Geoportail France
- bounds
- [[-21.4756, -63.3725], [51.3121, 55.9259]]
- min_zoom
- 0
- max_zoom
- 16
- apikey
- agriculture
- format
- image/png
- style
- normal
- variant
- LANDUSE.AGRICULTURE2014
- TileMatrixSet
- PM
-
xyzservices.TileProviderGeoportailFrance.Landuse_Agriculture2015
- url
- https://wxs.ign.fr/{apikey}/geoportail/wmts?REQUEST=GetTile&SERVICE=WMTS&VERSION=1.0.0&STYLE={style}&TILEMATRIXSET={TileMatrixSet}&FORMAT={format}&LAYER={variant}&TILEMATRIX={z}&TILEROW={y}&TILECOL={x}
- html_attribution
- Geoportail France
- attribution
- Geoportail France
- bounds
- [[-21.4756, -63.3725], [51.3121, 55.9259]]
- min_zoom
- 6
- max_zoom
- 16
- apikey
- agriculture
- format
- image/png
- style
- normal
- variant
- LANDUSE.AGRICULTURE2015
- TileMatrixSet
- PM
-
xyzservices.TileProviderGeoportailFrance.Landuse_Agriculture2016
- url
- https://wxs.ign.fr/{apikey}/geoportail/wmts?REQUEST=GetTile&SERVICE=WMTS&VERSION=1.0.0&STYLE={style}&TILEMATRIXSET={TileMatrixSet}&FORMAT={format}&LAYER={variant}&TILEMATRIX={z}&TILEROW={y}&TILECOL={x}
- html_attribution
- Geoportail France
- attribution
- Geoportail France
- bounds
- [[-21.4756, -63.3725], [51.3121, 55.9259]]
- min_zoom
- 6
- max_zoom
- 16
- apikey
- agriculture
- format
- image/png
- style
- normal
- variant
- LANDUSE.AGRICULTURE2016
- TileMatrixSet
- PM
-
xyzservices.TileProviderGeoportailFrance.Landuse_Agriculture2017
- url
- https://wxs.ign.fr/{apikey}/geoportail/wmts?REQUEST=GetTile&SERVICE=WMTS&VERSION=1.0.0&STYLE={style}&TILEMATRIXSET={TileMatrixSet}&FORMAT={format}&LAYER={variant}&TILEMATRIX={z}&TILEROW={y}&TILECOL={x}
- html_attribution
- Geoportail France
- attribution
- Geoportail France
- bounds
- [[-75.0, -179.5], [75.0, 179.5]]
- min_zoom
- 6
- max_zoom
- 16
- apikey
- agriculture
- format
- image/png
- style
- normal
- variant
- LANDUSE.AGRICULTURE2017
- TileMatrixSet
- PM
-
xyzservices.TileProviderGeoportailFrance.Landuse_Agriculture2018
- url
- https://wxs.ign.fr/{apikey}/geoportail/wmts?REQUEST=GetTile&SERVICE=WMTS&VERSION=1.0.0&STYLE={style}&TILEMATRIXSET={TileMatrixSet}&FORMAT={format}&LAYER={variant}&TILEMATRIX={z}&TILEROW={y}&TILECOL={x}
- html_attribution
- Geoportail France
- attribution
- Geoportail France
- bounds
- [[-21.4756, -63.3725], [51.3121, 55.9259]]
- min_zoom
- 6
- max_zoom
- 16
- apikey
- agriculture
- format
- image/png
- style
- normal
- variant
- LANDUSE.AGRICULTURE2018
- TileMatrixSet
- PM
-
xyzservices.TileProviderGeoportailFrance.Landuse_Agriculture2019
- url
- https://wxs.ign.fr/{apikey}/geoportail/wmts?REQUEST=GetTile&SERVICE=WMTS&VERSION=1.0.0&STYLE={style}&TILEMATRIXSET={TileMatrixSet}&FORMAT={format}&LAYER={variant}&TILEMATRIX={z}&TILEROW={y}&TILECOL={x}
- html_attribution
- Geoportail France
- attribution
- Geoportail France
- bounds
- [[-21.4756, -63.3725], [51.3121, 55.9259]]
- min_zoom
- 6
- max_zoom
- 16
- apikey
- agriculture
- format
- image/png
- style
- normal
- variant
- LANDUSE.AGRICULTURE2019
- TileMatrixSet
- PM
-
xyzservices.TileProviderGeoportailFrance.Landuse_Agriculture2020
- url
- https://wxs.ign.fr/{apikey}/geoportail/wmts?REQUEST=GetTile&SERVICE=WMTS&VERSION=1.0.0&STYLE={style}&TILEMATRIXSET={TileMatrixSet}&FORMAT={format}&LAYER={variant}&TILEMATRIX={z}&TILEROW={y}&TILECOL={x}
- html_attribution
- Geoportail France
- attribution
- Geoportail France
- bounds
- [[-21.4756, -63.3725], [51.3121, 55.9259]]
- min_zoom
- 6
- max_zoom
- 16
- apikey
- agriculture
- format
- image/png
- style
- normal
- variant
- LANDUSE.AGRICULTURE2020
- TileMatrixSet
- PM
-
xyzservices.TileProviderGeoportailFrance.Landuse_Agriculture2021
- url
- https://wxs.ign.fr/{apikey}/geoportail/wmts?REQUEST=GetTile&SERVICE=WMTS&VERSION=1.0.0&STYLE={style}&TILEMATRIXSET={TileMatrixSet}&FORMAT={format}&LAYER={variant}&TILEMATRIX={z}&TILEROW={y}&TILECOL={x}
- html_attribution
- Geoportail France
- attribution
- Geoportail France
- bounds
- [[-21.4756, -63.3725], [51.3121, 55.9259]]
- min_zoom
- 6
- max_zoom
- 16
- apikey
- agriculture
- format
- image/png
- style
- normal
- variant
- LANDUSE.AGRICULTURE2021
- TileMatrixSet
- PM
-
xyzservices.TileProviderGeoportailFrance.Prairies_Sensibles_Bcae
- url
- https://wxs.ign.fr/{apikey}/geoportail/wmts?REQUEST=GetTile&SERVICE=WMTS&VERSION=1.0.0&STYLE={style}&TILEMATRIXSET={TileMatrixSet}&FORMAT={format}&LAYER={variant}&TILEMATRIX={z}&TILEROW={y}&TILECOL={x}
- html_attribution
- Geoportail France
- attribution
- Geoportail France
- bounds
- [[41.3252, -5.15047], [51.0991, 9.57054]]
- min_zoom
- 6
- max_zoom
- 16
- apikey
- agriculture
- format
- image/png
- style
- nolegend
- variant
- PRAIRIES.SENSIBLES.BCAE
- TileMatrixSet
- PM
-
xyzservices.TileProviderGeoportailFrance.Elevation_Contour_Line
- url
- https://wxs.ign.fr/{apikey}/geoportail/wmts?REQUEST=GetTile&SERVICE=WMTS&VERSION=1.0.0&STYLE={style}&TILEMATRIXSET={TileMatrixSet}&FORMAT={format}&LAYER={variant}&TILEMATRIX={z}&TILEROW={y}&TILECOL={x}
- html_attribution
- Geoportail France
- attribution
- Geoportail France
- bounds
- [[-21.4756, -63.3725], [51.3121, 55.9259]]
- min_zoom
- 6
- max_zoom
- 18
- apikey
- altimetrie
- format
- image/png
- style
- normal
- variant
- ELEVATION.CONTOUR.LINE
- TileMatrixSet
- PM
-
xyzservices.TileProviderGeoportailFrance.Elevation_Elevationgridcoverage_Shadow
- url
- https://wxs.ign.fr/{apikey}/geoportail/wmts?REQUEST=GetTile&SERVICE=WMTS&VERSION=1.0.0&STYLE={style}&TILEMATRIXSET={TileMatrixSet}&FORMAT={format}&LAYER={variant}&TILEMATRIX={z}&TILEROW={y}&TILECOL={x}
- html_attribution
- Geoportail France
- attribution
- Geoportail France
- bounds
- [[-21.4069, -63.187], [50.9218, 55.8884]]
- min_zoom
- 0
- max_zoom
- 15
- apikey
- altimetrie
- format
- image/png
- style
- estompage_grayscale
- variant
- ELEVATION.ELEVATIONGRIDCOVERAGE.SHADOW
- TileMatrixSet
- PM
-
xyzservices.TileProviderGeoportailFrance.Elevation_Elevationgridcoverage_Threshold
- url
- https://wxs.ign.fr/{apikey}/geoportail/wmts?REQUEST=GetTile&SERVICE=WMTS&VERSION=1.0.0&STYLE={style}&TILEMATRIXSET={TileMatrixSet}&FORMAT={format}&LAYER={variant}&TILEMATRIX={z}&TILEROW={y}&TILECOL={x}
- html_attribution
- Geoportail France
- attribution
- Geoportail France
- bounds
- [[41.3252, -5.15047], [51.0991, 9.57054]]
- min_zoom
- 3
- max_zoom
- 17
- apikey
- altimetrie
- format
- image/png
- style
- ELEVATION.ELEVATIONGRIDCOVERAGE.THRESHOLD
- variant
- ELEVATION.ELEVATIONGRIDCOVERAGE.THRESHOLD
- TileMatrixSet
- PM
-
xyzservices.TileProviderGeoportailFrance.Elevation_Level0
- url
- https://wxs.ign.fr/{apikey}/geoportail/wmts?REQUEST=GetTile&SERVICE=WMTS&VERSION=1.0.0&STYLE={style}&TILEMATRIXSET={TileMatrixSet}&FORMAT={format}&LAYER={variant}&TILEMATRIX={z}&TILEROW={y}&TILECOL={x}
- html_attribution
- Geoportail France
- attribution
- Geoportail France
- bounds
- [[-21.51, -63.2529], [51.1388, 55.9472]]
- min_zoom
- 6
- max_zoom
- 18
- apikey
- altimetrie
- format
- image/png
- style
- normal
- variant
- ELEVATION.LEVEL0
- TileMatrixSet
- PM
-
xyzservices.TileProviderGeoportailFrance.Elevation_Slopes
- url
- https://wxs.ign.fr/{apikey}/geoportail/wmts?REQUEST=GetTile&SERVICE=WMTS&VERSION=1.0.0&STYLE={style}&TILEMATRIXSET={TileMatrixSet}&FORMAT={format}&LAYER={variant}&TILEMATRIX={z}&TILEROW={y}&TILECOL={x}
- html_attribution
- Geoportail France
- attribution
- Geoportail France
- bounds
- [[-22.5952, -178.206], [50.9308, 167.432]]
- min_zoom
- 6
- max_zoom
- 14
- apikey
- altimetrie
- format
- image/jpeg
- style
- normal
- variant
- ELEVATION.SLOPES
- TileMatrixSet
- PM
-
xyzservices.TileProviderGeoportailFrance.Elevationgridcoverage_Highres_Quality
- url
- https://wxs.ign.fr/{apikey}/geoportail/wmts?REQUEST=GetTile&SERVICE=WMTS&VERSION=1.0.0&STYLE={style}&TILEMATRIXSET={TileMatrixSet}&FORMAT={format}&LAYER={variant}&TILEMATRIX={z}&TILEROW={y}&TILECOL={x}
- html_attribution
- Geoportail France
- attribution
- Geoportail France
- bounds
- [[-21.4756, -63.3725], [51.3121, 55.9259]]
- min_zoom
- 6
- max_zoom
- 16
- apikey
- altimetrie
- format
- image/png
- style
- Graphe de source du RGE Alti
- variant
- ELEVATIONGRIDCOVERAGE.HIGHRES.QUALITY
- TileMatrixSet
- PM
-
xyzservices.TileProviderGeoportailFrance.Geographicalgridsystems_Slopes_Mountain
- url
- https://wxs.ign.fr/{apikey}/geoportail/wmts?REQUEST=GetTile&SERVICE=WMTS&VERSION=1.0.0&STYLE={style}&TILEMATRIXSET={TileMatrixSet}&FORMAT={format}&LAYER={variant}&TILEMATRIX={z}&TILEROW={y}&TILECOL={x}
- html_attribution
- Geoportail France
- attribution
- Geoportail France
- bounds
- [[-21.5446, -63.1614], [51.0991, 56.0018]]
- min_zoom
- 0
- max_zoom
- 17
- apikey
- altimetrie
- format
- image/png
- style
- normal
- variant
- GEOGRAPHICALGRIDSYSTEMS.SLOPES.MOUNTAIN
- TileMatrixSet
- PM
-
xyzservices.TileProviderGeoportailFrance.Geographicalgridsystems_1900typemaps
- url
- https://wxs.ign.fr/{apikey}/geoportail/wmts?REQUEST=GetTile&SERVICE=WMTS&VERSION=1.0.0&STYLE={style}&TILEMATRIXSET={TileMatrixSet}&FORMAT={format}&LAYER={variant}&TILEMATRIX={z}&TILEROW={y}&TILECOL={x}
- html_attribution
- Geoportail France
- attribution
- Geoportail France
- bounds
- [[48.4726, 1.62941], [49.1548, 3.0]]
- min_zoom
- 10
- max_zoom
- 15
- apikey
- cartes
- format
- image/jpeg
- style
- normal
- variant
- GEOGRAPHICALGRIDSYSTEMS.1900TYPEMAPS
- TileMatrixSet
- PM
-
xyzservices.TileProviderGeoportailFrance.Geographicalgridsystems_Bonne
- url
- https://wxs.ign.fr/{apikey}/geoportail/wmts?REQUEST=GetTile&SERVICE=WMTS&VERSION=1.0.0&STYLE={style}&TILEMATRIXSET={TileMatrixSet}&FORMAT={format}&LAYER={variant}&TILEMATRIX={z}&TILEROW={y}&TILECOL={x}
- html_attribution
- Geoportail France
- attribution
- Geoportail France
- bounds
- [[-0.49941, -55.9127], [7.88966, -50.0835]]
- min_zoom
- 0
- max_zoom
- 10
- apikey
- cartes
- format
- image/jpeg
- style
- normal
- variant
- GEOGRAPHICALGRIDSYSTEMS.BONNE
- TileMatrixSet
- PM
-
xyzservices.TileProviderGeoportailFrance.Geographicalgridsystems_Etatmajor10
- url
- https://wxs.ign.fr/{apikey}/geoportail/wmts?REQUEST=GetTile&SERVICE=WMTS&VERSION=1.0.0&STYLE={style}&TILEMATRIXSET={TileMatrixSet}&FORMAT={format}&LAYER={variant}&TILEMATRIX={z}&TILEROW={y}&TILECOL={x}
- html_attribution
- Geoportail France
- attribution
- Geoportail France
- bounds
- [[48.3847, 1.82682], [49.5142, 2.79738]]
- min_zoom
- 6
- max_zoom
- 16
- apikey
- cartes
- format
- image/jpeg
- style
- normal
- variant
- GEOGRAPHICALGRIDSYSTEMS.ETATMAJOR10
- TileMatrixSet
- PM
-
xyzservices.TileProviderGeoportailFrance.Geographicalgridsystems_Etatmajor40
- url
- https://wxs.ign.fr/{apikey}/geoportail/wmts?REQUEST=GetTile&SERVICE=WMTS&VERSION=1.0.0&STYLE={style}&TILEMATRIXSET={TileMatrixSet}&FORMAT={format}&LAYER={variant}&TILEMATRIX={z}&TILEROW={y}&TILECOL={x}
- html_attribution
- Geoportail France
- attribution
- Geoportail France
- bounds
- [[41.1844, -6.08889], [51.2745, 10.961]]
- min_zoom
- 6
- max_zoom
- 15
- apikey
- cartes
- format
- image/jpeg
- style
- normal
- variant
- GEOGRAPHICALGRIDSYSTEMS.ETATMAJOR40
- TileMatrixSet
- PM
-
xyzservices.TileProviderGeoportailFrance.Geographicalgridsystems_Maps_Bduni_J1
- url
- https://wxs.ign.fr/{apikey}/geoportail/wmts?REQUEST=GetTile&SERVICE=WMTS&VERSION=1.0.0&STYLE={style}&TILEMATRIXSET={TileMatrixSet}&FORMAT={format}&LAYER={variant}&TILEMATRIX={z}&TILEROW={y}&TILECOL={x}
- html_attribution
- Geoportail France
- attribution
- Geoportail France
- bounds
- [[-75.0, -179.5], [75.0, 179.5]]
- min_zoom
- 0
- max_zoom
- 18
- apikey
- cartes
- format
- image/png
- style
- normal
- variant
- GEOGRAPHICALGRIDSYSTEMS.MAPS.BDUNI.J1
- TileMatrixSet
- PM
-
xyzservices.TileProviderGeoportailFrance.Geographicalgridsystems_Maps_Overview
- url
- https://wxs.ign.fr/{apikey}/geoportail/wmts?REQUEST=GetTile&SERVICE=WMTS&VERSION=1.0.0&STYLE={style}&TILEMATRIXSET={TileMatrixSet}&FORMAT={format}&LAYER={variant}&TILEMATRIX={z}&TILEROW={y}&TILECOL={x}
- html_attribution
- Geoportail France
- attribution
- Geoportail France
- bounds
- [[-75.0, -179.5], [75.0, 179.5]]
- min_zoom
- 1
- max_zoom
- 8
- apikey
- cartes
- format
- image/jpeg
- style
- normal
- variant
- GEOGRAPHICALGRIDSYSTEMS.MAPS.OVERVIEW
- TileMatrixSet
- PM
-
xyzservices.TileProviderGeoportailFrance.Geographicalgridsystems_Maps_Scan50_1950
- url
- https://wxs.ign.fr/{apikey}/geoportail/wmts?REQUEST=GetTile&SERVICE=WMTS&VERSION=1.0.0&STYLE={style}&TILEMATRIXSET={TileMatrixSet}&FORMAT={format}&LAYER={variant}&TILEMATRIX={z}&TILEROW={y}&TILECOL={x}
- html_attribution
- Geoportail France
- attribution
- Geoportail France
- bounds
- [[-75.0, -179.5], [75.0, 179.5]]
- min_zoom
- 3
- max_zoom
- 15
- apikey
- cartes
- format
- image/jpeg
- style
- SCAN50_1950
- variant
- GEOGRAPHICALGRIDSYSTEMS.MAPS.SCAN50.1950
- TileMatrixSet
- PM
-
xyzservices.TileProviderGeoportailFrance.Geographicalgridsystems_Terrier_v1
- url
- https://wxs.ign.fr/{apikey}/geoportail/wmts?REQUEST=GetTile&SERVICE=WMTS&VERSION=1.0.0&STYLE={style}&TILEMATRIXSET={TileMatrixSet}&FORMAT={format}&LAYER={variant}&TILEMATRIX={z}&TILEROW={y}&TILECOL={x}
- html_attribution
- Geoportail France
- attribution
- Geoportail France
- bounds
- [[41.2568, 8.36284], [43.1174, 9.75281]]
- min_zoom
- 6
- max_zoom
- 18
- apikey
- cartes
- format
- image/png
- style
- nolegend
- variant
- GEOGRAPHICALGRIDSYSTEMS.TERRIER_V1
- TileMatrixSet
- PM
-
xyzservices.TileProviderGeoportailFrance.Geographicalgridsystems_Terrier_v2
- url
- https://wxs.ign.fr/{apikey}/geoportail/wmts?REQUEST=GetTile&SERVICE=WMTS&VERSION=1.0.0&STYLE={style}&TILEMATRIXSET={TileMatrixSet}&FORMAT={format}&LAYER={variant}&TILEMATRIX={z}&TILEROW={y}&TILECOL={x}
- html_attribution
- Geoportail France
- attribution
- Geoportail France
- bounds
- [[41.2568, 8.36284], [43.1174, 9.75282]]
- min_zoom
- 6
- max_zoom
- 18
- apikey
- cartes
- format
- image/png
- style
- nolegend
- variant
- GEOGRAPHICALGRIDSYSTEMS.TERRIER_V2
- TileMatrixSet
- PM
-
xyzservices.TileProviderGeoportailFrance.Landcover_Cha00_fr
- url
- https://wxs.ign.fr/{apikey}/geoportail/wmts?REQUEST=GetTile&SERVICE=WMTS&VERSION=1.0.0&STYLE={style}&TILEMATRIXSET={TileMatrixSet}&FORMAT={format}&LAYER={variant}&TILEMATRIX={z}&TILEROW={y}&TILECOL={x}
- html_attribution
- Geoportail France
- attribution
- Geoportail France
- bounds
- [[40.576, -9.88147], [51.4428, 11.6781]]
- min_zoom
- 0
- max_zoom
- 16
- apikey
- clc
- format
- image/png
- style
- CORINE Land Cover - France métropolitaine
- variant
- LANDCOVER.CHA00_FR
- TileMatrixSet
- PM
-
xyzservices.TileProviderGeoportailFrance.Landcover_Cha06_dom
- url
- https://wxs.ign.fr/{apikey}/geoportail/wmts?REQUEST=GetTile&SERVICE=WMTS&VERSION=1.0.0&STYLE={style}&TILEMATRIXSET={TileMatrixSet}&FORMAT={format}&LAYER={variant}&TILEMATRIX={z}&TILEROW={y}&TILECOL={x}
- html_attribution
- Geoportail France
- attribution
- Geoportail France
- bounds
- [[-21.4756, -63.3725], [47.1747, 55.9259]]
- min_zoom
- 0
- max_zoom
- 16
- apikey
- clc
- format
- image/png
- style
- CORINE Land Cover - DOM
- variant
- LANDCOVER.CHA06_DOM
- TileMatrixSet
- PM
-
xyzservices.TileProviderGeoportailFrance.Landcover_Cha06_fr
- url
- https://wxs.ign.fr/{apikey}/geoportail/wmts?REQUEST=GetTile&SERVICE=WMTS&VERSION=1.0.0&STYLE={style}&TILEMATRIXSET={TileMatrixSet}&FORMAT={format}&LAYER={variant}&TILEMATRIX={z}&TILEROW={y}&TILECOL={x}
- html_attribution
- Geoportail France
- attribution
- Geoportail France
- bounds
- [[40.576, -9.88147], [51.4428, 11.6781]]
- min_zoom
- 0
- max_zoom
- 16
- apikey
- clc
- format
- image/png
- style
- CORINE Land Cover - France métropolitaine
- variant
- LANDCOVER.CHA06_FR
- TileMatrixSet
- PM
-
xyzservices.TileProviderGeoportailFrance.Landcover_Cha12_dom
- url
- https://wxs.ign.fr/{apikey}/geoportail/wmts?REQUEST=GetTile&SERVICE=WMTS&VERSION=1.0.0&STYLE={style}&TILEMATRIXSET={TileMatrixSet}&FORMAT={format}&LAYER={variant}&TILEMATRIX={z}&TILEROW={y}&TILECOL={x}
- html_attribution
- Geoportail France
- attribution
- Geoportail France
- bounds
- [[-21.4756, -63.3725], [47.1747, 55.9259]]
- min_zoom
- 0
- max_zoom
- 16
- apikey
- clc
- format
- image/png
- style
- CORINE Land Cover - DOM
- variant
- LANDCOVER.CHA12_DOM
- TileMatrixSet
- PM
-
xyzservices.TileProviderGeoportailFrance.Landcover_Cha12_fr
- url
- https://wxs.ign.fr/{apikey}/geoportail/wmts?REQUEST=GetTile&SERVICE=WMTS&VERSION=1.0.0&STYLE={style}&TILEMATRIXSET={TileMatrixSet}&FORMAT={format}&LAYER={variant}&TILEMATRIX={z}&TILEROW={y}&TILECOL={x}
- html_attribution
- Geoportail France
- attribution
- Geoportail France
- bounds
- [[40.576, -9.88147], [51.4428, 11.6781]]
- min_zoom
- 0
- max_zoom
- 16
- apikey
- clc
- format
- image/png
- style
- CORINE Land Cover - France métropolitaine
- variant
- LANDCOVER.CHA12_FR
- TileMatrixSet
- PM
-
xyzservices.TileProviderGeoportailFrance.Landcover_Cha18
- url
- https://wxs.ign.fr/{apikey}/geoportail/wmts?REQUEST=GetTile&SERVICE=WMTS&VERSION=1.0.0&STYLE={style}&TILEMATRIXSET={TileMatrixSet}&FORMAT={format}&LAYER={variant}&TILEMATRIX={z}&TILEROW={y}&TILECOL={x}
- html_attribution
- Geoportail France
- attribution
- Geoportail France
- bounds
- [[-21.4756, -63.3725], [51.4428, 55.9259]]
- min_zoom
- 0
- max_zoom
- 16
- apikey
- clc
- format
- image/png
- style
- CORINE Land Cover
- variant
- LANDCOVER.CHA18
- TileMatrixSet
- PM
-
xyzservices.TileProviderGeoportailFrance.Landcover_Cha18_dom
- url
- https://wxs.ign.fr/{apikey}/geoportail/wmts?REQUEST=GetTile&SERVICE=WMTS&VERSION=1.0.0&STYLE={style}&TILEMATRIXSET={TileMatrixSet}&FORMAT={format}&LAYER={variant}&TILEMATRIX={z}&TILEROW={y}&TILECOL={x}
- html_attribution
- Geoportail France
- attribution
- Geoportail France
- bounds
- [[-21.4756, -63.3725], [47.1747, 55.9259]]
- min_zoom
- 0
- max_zoom
- 16
- apikey
- clc
- format
- image/png
- style
- CORINE Land Cover - DOM
- variant
- LANDCOVER.CHA18_DOM
- TileMatrixSet
- PM
-
xyzservices.TileProviderGeoportailFrance.Landcover_Cha18_fr
- url
- https://wxs.ign.fr/{apikey}/geoportail/wmts?REQUEST=GetTile&SERVICE=WMTS&VERSION=1.0.0&STYLE={style}&TILEMATRIXSET={TileMatrixSet}&FORMAT={format}&LAYER={variant}&TILEMATRIX={z}&TILEROW={y}&TILECOL={x}
- html_attribution
- Geoportail France
- attribution
- Geoportail France
- bounds
- [[40.576, -9.88147], [51.4428, 11.6781]]
- min_zoom
- 0
- max_zoom
- 16
- apikey
- clc
- format
- image/png
- style
- CORINE Land Cover - France métropolitaine
- variant
- LANDCOVER.CHA18_FR
- TileMatrixSet
- PM
-
xyzservices.TileProviderGeoportailFrance.Landcover_Clc00r_fr
- url
- https://wxs.ign.fr/{apikey}/geoportail/wmts?REQUEST=GetTile&SERVICE=WMTS&VERSION=1.0.0&STYLE={style}&TILEMATRIXSET={TileMatrixSet}&FORMAT={format}&LAYER={variant}&TILEMATRIX={z}&TILEROW={y}&TILECOL={x}
- html_attribution
- Geoportail France
- attribution
- Geoportail France
- bounds
- [[40.576, -9.88147], [51.4428, 11.6781]]
- min_zoom
- 0
- max_zoom
- 16
- apikey
- clc
- format
- image/png
- style
- CORINE Land Cover - France métropolitaine
- variant
- LANDCOVER.CLC00R_FR
- TileMatrixSet
- PM
-
xyzservices.TileProviderGeoportailFrance.Landcover_Clc00_dom
- url
- https://wxs.ign.fr/{apikey}/geoportail/wmts?REQUEST=GetTile&SERVICE=WMTS&VERSION=1.0.0&STYLE={style}&TILEMATRIXSET={TileMatrixSet}&FORMAT={format}&LAYER={variant}&TILEMATRIX={z}&TILEROW={y}&TILECOL={x}
- html_attribution
- Geoportail France
- attribution
- Geoportail France
- bounds
- [[-21.4756, -63.3725], [47.1747, 55.9259]]
- min_zoom
- 0
- max_zoom
- 16
- apikey
- clc
- format
- image/png
- style
- CORINE Land Cover - DOM
- variant
- LANDCOVER.CLC00_DOM
- TileMatrixSet
- PM
-
xyzservices.TileProviderGeoportailFrance.Landcover_Clc00_fr
- url
- https://wxs.ign.fr/{apikey}/geoportail/wmts?REQUEST=GetTile&SERVICE=WMTS&VERSION=1.0.0&STYLE={style}&TILEMATRIXSET={TileMatrixSet}&FORMAT={format}&LAYER={variant}&TILEMATRIX={z}&TILEROW={y}&TILECOL={x}
- html_attribution
- Geoportail France
- attribution
- Geoportail France
- bounds
- [[40.576, -9.88147], [51.4428, 11.6781]]
- min_zoom
- 0
- max_zoom
- 16
- apikey
- clc
- format
- image/png
- style
- CORINE Land Cover - France métropolitaine
- variant
- LANDCOVER.CLC00_FR
- TileMatrixSet
- PM
-
xyzservices.TileProviderGeoportailFrance.Landcover_Clc06r_dom
- url
- https://wxs.ign.fr/{apikey}/geoportail/wmts?REQUEST=GetTile&SERVICE=WMTS&VERSION=1.0.0&STYLE={style}&TILEMATRIXSET={TileMatrixSet}&FORMAT={format}&LAYER={variant}&TILEMATRIX={z}&TILEROW={y}&TILECOL={x}
- html_attribution
- Geoportail France
- attribution
- Geoportail France
- bounds
- [[-21.4756, -63.3725], [47.1747, 55.9259]]
- min_zoom
- 0
- max_zoom
- 16
- apikey
- clc
- format
- image/png
- style
- CORINE Land Cover - DOM
- variant
- LANDCOVER.CLC06R_DOM
- TileMatrixSet
- PM
-
xyzservices.TileProviderGeoportailFrance.Landcover_Clc06r_fr
- url
- https://wxs.ign.fr/{apikey}/geoportail/wmts?REQUEST=GetTile&SERVICE=WMTS&VERSION=1.0.0&STYLE={style}&TILEMATRIXSET={TileMatrixSet}&FORMAT={format}&LAYER={variant}&TILEMATRIX={z}&TILEROW={y}&TILECOL={x}
- html_attribution
- Geoportail France
- attribution
- Geoportail France
- bounds
- [[40.576, -9.88147], [51.4428, 11.6781]]
- min_zoom
- 0
- max_zoom
- 16
- apikey
- clc
- format
- image/png
- style
- CORINE Land Cover - France métropolitaine
- variant
- LANDCOVER.CLC06R_FR
- TileMatrixSet
- PM
-
xyzservices.TileProviderGeoportailFrance.Landcover_Clc06_dom
- url
- https://wxs.ign.fr/{apikey}/geoportail/wmts?REQUEST=GetTile&SERVICE=WMTS&VERSION=1.0.0&STYLE={style}&TILEMATRIXSET={TileMatrixSet}&FORMAT={format}&LAYER={variant}&TILEMATRIX={z}&TILEROW={y}&TILECOL={x}
- html_attribution
- Geoportail France
- attribution
- Geoportail France
- bounds
- [[-21.4756, -63.3725], [47.1747, 55.9259]]
- min_zoom
- 0
- max_zoom
- 16
- apikey
- clc
- format
- image/png
- style
- CORINE Land Cover - DOM
- variant
- LANDCOVER.CLC06_DOM
- TileMatrixSet
- PM
-
xyzservices.TileProviderGeoportailFrance.Landcover_Clc06_fr
- url
- https://wxs.ign.fr/{apikey}/geoportail/wmts?REQUEST=GetTile&SERVICE=WMTS&VERSION=1.0.0&STYLE={style}&TILEMATRIXSET={TileMatrixSet}&FORMAT={format}&LAYER={variant}&TILEMATRIX={z}&TILEROW={y}&TILECOL={x}
- html_attribution
- Geoportail France
- attribution
- Geoportail France
- bounds
- [[40.576, -9.88147], [51.4428, 11.6781]]
- min_zoom
- 0
- max_zoom
- 16
- apikey
- clc
- format
- image/png
- style
- CORINE Land Cover - France métropolitaine
- variant
- LANDCOVER.CLC06_FR
- TileMatrixSet
- PM
-
xyzservices.TileProviderGeoportailFrance.Landcover_Clc12
- url
- https://wxs.ign.fr/{apikey}/geoportail/wmts?REQUEST=GetTile&SERVICE=WMTS&VERSION=1.0.0&STYLE={style}&TILEMATRIXSET={TileMatrixSet}&FORMAT={format}&LAYER={variant}&TILEMATRIX={z}&TILEROW={y}&TILECOL={x}
- html_attribution
- Geoportail France
- attribution
- Geoportail France
- bounds
- [[-21.4756, -63.3725], [51.4428, 55.9259]]
- min_zoom
- 0
- max_zoom
- 16
- apikey
- clc
- format
- image/png
- style
- CORINE Land Cover - DOM
- variant
- LANDCOVER.CLC12
- TileMatrixSet
- PM
-
xyzservices.TileProviderGeoportailFrance.Landcover_Clc12r
- url
- https://wxs.ign.fr/{apikey}/geoportail/wmts?REQUEST=GetTile&SERVICE=WMTS&VERSION=1.0.0&STYLE={style}&TILEMATRIXSET={TileMatrixSet}&FORMAT={format}&LAYER={variant}&TILEMATRIX={z}&TILEROW={y}&TILECOL={x}
- html_attribution
- Geoportail France
- attribution
- Geoportail France
- bounds
- [[-21.4756, -63.3725], [51.4428, 55.9259]]
- min_zoom
- 0
- max_zoom
- 16
- apikey
- clc
- format
- image/png
- style
- CORINE Land Cover
- variant
- LANDCOVER.CLC12R
- TileMatrixSet
- PM
-
xyzservices.TileProviderGeoportailFrance.Landcover_Clc12r_dom
- url
- https://wxs.ign.fr/{apikey}/geoportail/wmts?REQUEST=GetTile&SERVICE=WMTS&VERSION=1.0.0&STYLE={style}&TILEMATRIXSET={TileMatrixSet}&FORMAT={format}&LAYER={variant}&TILEMATRIX={z}&TILEROW={y}&TILECOL={x}
- html_attribution
- Geoportail France
- attribution
- Geoportail France
- bounds
- [[-21.4756, -63.3725], [47.1747, 55.9259]]
- min_zoom
- 0
- max_zoom
- 16
- apikey
- clc
- format
- image/png
- style
- CORINE Land Cover - DOM
- variant
- LANDCOVER.CLC12R_DOM
- TileMatrixSet
- PM
-
xyzservices.TileProviderGeoportailFrance.Landcover_Clc12r_fr
- url
- https://wxs.ign.fr/{apikey}/geoportail/wmts?REQUEST=GetTile&SERVICE=WMTS&VERSION=1.0.0&STYLE={style}&TILEMATRIXSET={TileMatrixSet}&FORMAT={format}&LAYER={variant}&TILEMATRIX={z}&TILEROW={y}&TILECOL={x}
- html_attribution
- Geoportail France
- attribution
- Geoportail France
- bounds
- [[40.576, -9.88147], [51.4428, 11.6781]]
- min_zoom
- 0
- max_zoom
- 16
- apikey
- clc
- format
- image/png
- style
- CORINE Land Cover - France métropolitaine
- variant
- LANDCOVER.CLC12R_FR
- TileMatrixSet
- PM
-
xyzservices.TileProviderGeoportailFrance.Landcover_Clc12_dom
- url
- https://wxs.ign.fr/{apikey}/geoportail/wmts?REQUEST=GetTile&SERVICE=WMTS&VERSION=1.0.0&STYLE={style}&TILEMATRIXSET={TileMatrixSet}&FORMAT={format}&LAYER={variant}&TILEMATRIX={z}&TILEROW={y}&TILECOL={x}
- html_attribution
- Geoportail France
- attribution
- Geoportail France
- bounds
- [[-21.4756, -63.3725], [47.1747, 55.9259]]
- min_zoom
- 0
- max_zoom
- 16
- apikey
- clc
- format
- image/png
- style
- CORINE Land Cover - DOM
- variant
- LANDCOVER.CLC12_DOM
- TileMatrixSet
- PM
-
xyzservices.TileProviderGeoportailFrance.Landcover_Clc12_fr
- url
- https://wxs.ign.fr/{apikey}/geoportail/wmts?REQUEST=GetTile&SERVICE=WMTS&VERSION=1.0.0&STYLE={style}&TILEMATRIXSET={TileMatrixSet}&FORMAT={format}&LAYER={variant}&TILEMATRIX={z}&TILEROW={y}&TILECOL={x}
- html_attribution
- Geoportail France
- attribution
- Geoportail France
- bounds
- [[40.576, -9.88147], [51.4428, 11.6781]]
- min_zoom
- 0
- max_zoom
- 16
- apikey
- clc
- format
- image/png
- style
- CORINE Land Cover - France métropolitaine
- variant
- LANDCOVER.CLC12_FR
- TileMatrixSet
- PM
-
xyzservices.TileProviderGeoportailFrance.Landcover_Clc18
- url
- https://wxs.ign.fr/{apikey}/geoportail/wmts?REQUEST=GetTile&SERVICE=WMTS&VERSION=1.0.0&STYLE={style}&TILEMATRIXSET={TileMatrixSet}&FORMAT={format}&LAYER={variant}&TILEMATRIX={z}&TILEROW={y}&TILECOL={x}
- html_attribution
- Geoportail France
- attribution
- Geoportail France
- bounds
- [[-21.4756, -63.3725], [51.4428, 55.9259]]
- min_zoom
- 0
- max_zoom
- 16
- apikey
- clc
- format
- image/png
- style
- CORINE Land Cover
- variant
- LANDCOVER.CLC18
- TileMatrixSet
- PM
-
xyzservices.TileProviderGeoportailFrance.Landcover_Clc18_dom
- url
- https://wxs.ign.fr/{apikey}/geoportail/wmts?REQUEST=GetTile&SERVICE=WMTS&VERSION=1.0.0&STYLE={style}&TILEMATRIXSET={TileMatrixSet}&FORMAT={format}&LAYER={variant}&TILEMATRIX={z}&TILEROW={y}&TILECOL={x}
- html_attribution
- Geoportail France
- attribution
- Geoportail France
- bounds
- [[-21.4756, -63.3725], [47.1747, 55.9259]]
- min_zoom
- 0
- max_zoom
- 16
- apikey
- clc
- format
- image/png
- style
- CORINE Land Cover - DOM
- variant
- LANDCOVER.CLC18_DOM
- TileMatrixSet
- PM
-
xyzservices.TileProviderGeoportailFrance.Landcover_Clc18_fr
- url
- https://wxs.ign.fr/{apikey}/geoportail/wmts?REQUEST=GetTile&SERVICE=WMTS&VERSION=1.0.0&STYLE={style}&TILEMATRIXSET={TileMatrixSet}&FORMAT={format}&LAYER={variant}&TILEMATRIX={z}&TILEROW={y}&TILECOL={x}
- html_attribution
- Geoportail France
- attribution
- Geoportail France
- bounds
- [[40.576, -9.88147], [51.4428, 11.6781]]
- min_zoom
- 0
- max_zoom
- 16
- apikey
- clc
- format
- image/png
- style
- CORINE Land Cover - France métropolitaine
- variant
- LANDCOVER.CLC18_FR
- TileMatrixSet
- PM
-
xyzservices.TileProviderGeoportailFrance.Landcover_Clc90_fr
- url
- https://wxs.ign.fr/{apikey}/geoportail/wmts?REQUEST=GetTile&SERVICE=WMTS&VERSION=1.0.0&STYLE={style}&TILEMATRIXSET={TileMatrixSet}&FORMAT={format}&LAYER={variant}&TILEMATRIX={z}&TILEROW={y}&TILECOL={x}
- html_attribution
- Geoportail France
- attribution
- Geoportail France
- bounds
- [[40.576, -9.88147], [51.4428, 11.6781]]
- min_zoom
- 0
- max_zoom
- 16
- apikey
- clc
- format
- image/png
- style
- CORINE Land Cover - France métropolitaine
- variant
- LANDCOVER.CLC90_FR
- TileMatrixSet
- PM
-
xyzservices.TileProviderGeoportailFrance.Landcover_Grid_Clc00
- url
- https://wxs.ign.fr/{apikey}/geoportail/wmts?REQUEST=GetTile&SERVICE=WMTS&VERSION=1.0.0&STYLE={style}&TILEMATRIXSET={TileMatrixSet}&FORMAT={format}&LAYER={variant}&TILEMATRIX={z}&TILEROW={y}&TILECOL={x}
- html_attribution
- Geoportail France
- attribution
- Geoportail France
- bounds
- [[-21.4825, -61.9063], [51.1827, 55.9362]]
- min_zoom
- 0
- max_zoom
- 13
- apikey
- clc
- format
- image/png
- style
- CORINE Land Cover
- variant
- LANDCOVER.GRID.CLC00
- TileMatrixSet
- PM
-
xyzservices.TileProviderGeoportailFrance.Landcover_Grid_Clc00r_fr
- url
- https://wxs.ign.fr/{apikey}/geoportail/wmts?REQUEST=GetTile&SERVICE=WMTS&VERSION=1.0.0&STYLE={style}&TILEMATRIXSET={TileMatrixSet}&FORMAT={format}&LAYER={variant}&TILEMATRIX={z}&TILEROW={y}&TILECOL={x}
- html_attribution
- Geoportail France
- attribution
- Geoportail France
- bounds
- [[41.1779, -5.68494], [51.1827, 10.8556]]
- min_zoom
- 0
- max_zoom
- 13
- apikey
- clc
- format
- image/png
- style
- CORINE Land Cover - France métropolitaine
- variant
- LANDCOVER.GRID.CLC00R_FR
- TileMatrixSet
- PM
-
xyzservices.TileProviderGeoportailFrance.Landcover_Grid_Clc00_dom
- url
- https://wxs.ign.fr/{apikey}/geoportail/wmts?REQUEST=GetTile&SERVICE=WMTS&VERSION=1.0.0&STYLE={style}&TILEMATRIXSET={TileMatrixSet}&FORMAT={format}&LAYER={variant}&TILEMATRIX={z}&TILEROW={y}&TILECOL={x}
- html_attribution
- Geoportail France
- attribution
- Geoportail France
- bounds
- [[-21.4825, -61.9063], [16.6077, 55.9362]]
- min_zoom
- 0
- max_zoom
- 12
- apikey
- clc
- format
- image/png
- style
- CORINE Land Cover - DOM
- variant
- LANDCOVER.GRID.CLC00_DOM
- TileMatrixSet
- PM
-
xyzservices.TileProviderGeoportailFrance.Landcover_Grid_Clc00_fr
- url
- https://wxs.ign.fr/{apikey}/geoportail/wmts?REQUEST=GetTile&SERVICE=WMTS&VERSION=1.0.0&STYLE={style}&TILEMATRIXSET={TileMatrixSet}&FORMAT={format}&LAYER={variant}&TILEMATRIX={z}&TILEROW={y}&TILECOL={x}
- html_attribution
- Geoportail France
- attribution
- Geoportail France
- bounds
- [[41.1779, -5.68494], [51.1827, 10.8556]]
- min_zoom
- 0
- max_zoom
- 12
- apikey
- clc
- format
- image/png
- style
- CORINE Land Cover - France métropolitaine
- variant
- LANDCOVER.GRID.CLC00_FR
- TileMatrixSet
- PM
-
xyzservices.TileProviderGeoportailFrance.Landcover_Grid_Clc06
- url
- https://wxs.ign.fr/{apikey}/geoportail/wmts?REQUEST=GetTile&SERVICE=WMTS&VERSION=1.0.0&STYLE={style}&TILEMATRIXSET={TileMatrixSet}&FORMAT={format}&LAYER={variant}&TILEMATRIX={z}&TILEROW={y}&TILECOL={x}
- html_attribution
- Geoportail France
- attribution
- Geoportail France
- bounds
- [[-21.4825, -61.9063], [51.1827, 55.9362]]
- min_zoom
- 0
- max_zoom
- 13
- apikey
- clc
- format
- image/png
- style
- CORINE Land Cover
- variant
- LANDCOVER.GRID.CLC06
- TileMatrixSet
- PM
-
xyzservices.TileProviderGeoportailFrance.Landcover_Grid_Clc06r
- url
- https://wxs.ign.fr/{apikey}/geoportail/wmts?REQUEST=GetTile&SERVICE=WMTS&VERSION=1.0.0&STYLE={style}&TILEMATRIXSET={TileMatrixSet}&FORMAT={format}&LAYER={variant}&TILEMATRIX={z}&TILEROW={y}&TILECOL={x}
- html_attribution
- Geoportail France
- attribution
- Geoportail France
- bounds
- [[-21.4825, -61.9063], [51.2963, 55.9362]]
- min_zoom
- 0
- max_zoom
- 13
- apikey
- clc
- format
- image/png
- style
- CORINE Land Cover
- variant
- LANDCOVER.GRID.CLC06R
- TileMatrixSet
- PM
-
xyzservices.TileProviderGeoportailFrance.Landcover_Grid_Clc06r_dom
- url
- https://wxs.ign.fr/{apikey}/geoportail/wmts?REQUEST=GetTile&SERVICE=WMTS&VERSION=1.0.0&STYLE={style}&TILEMATRIXSET={TileMatrixSet}&FORMAT={format}&LAYER={variant}&TILEMATRIX={z}&TILEROW={y}&TILECOL={x}
- html_attribution
- Geoportail France
- attribution
- Geoportail France
- bounds
- [[-21.4825, -61.9063], [16.6077, 55.9362]]
- min_zoom
- 0
- max_zoom
- 12
- apikey
- clc
- format
- image/png
- style
- CORINE Land Cover - DOM
- variant
- LANDCOVER.GRID.CLC06R_DOM
- TileMatrixSet
- PM
-
xyzservices.TileProviderGeoportailFrance.Landcover_Grid_Clc06r_fr
- url
- https://wxs.ign.fr/{apikey}/geoportail/wmts?REQUEST=GetTile&SERVICE=WMTS&VERSION=1.0.0&STYLE={style}&TILEMATRIXSET={TileMatrixSet}&FORMAT={format}&LAYER={variant}&TILEMATRIX={z}&TILEROW={y}&TILECOL={x}
- html_attribution
- Geoportail France
- attribution
- Geoportail France
- bounds
- [[41.0278, -5.91689], [51.2963, 11.0883]]
- min_zoom
- 0
- max_zoom
- 12
- apikey
- clc
- format
- image/png
- style
- CORINE Land Cover - France métropolitaine
- variant
- LANDCOVER.GRID.CLC06R_FR
- TileMatrixSet
- PM
-
xyzservices.TileProviderGeoportailFrance.Landcover_Grid_Clc06_dom
- url
- https://wxs.ign.fr/{apikey}/geoportail/wmts?REQUEST=GetTile&SERVICE=WMTS&VERSION=1.0.0&STYLE={style}&TILEMATRIXSET={TileMatrixSet}&FORMAT={format}&LAYER={variant}&TILEMATRIX={z}&TILEROW={y}&TILECOL={x}
- html_attribution
- Geoportail France
- attribution
- Geoportail France
- bounds
- [[-21.4825, -61.9063], [16.6077, 55.9362]]
- min_zoom
- 0
- max_zoom
- 12
- apikey
- clc
- format
- image/png
- style
- CORINE Land Cover - DOM
- variant
- LANDCOVER.GRID.CLC06_DOM
- TileMatrixSet
- PM
-
xyzservices.TileProviderGeoportailFrance.Landcover_Grid_Clc06_fr
- url
- https://wxs.ign.fr/{apikey}/geoportail/wmts?REQUEST=GetTile&SERVICE=WMTS&VERSION=1.0.0&STYLE={style}&TILEMATRIXSET={TileMatrixSet}&FORMAT={format}&LAYER={variant}&TILEMATRIX={z}&TILEROW={y}&TILECOL={x}
- html_attribution
- Geoportail France
- attribution
- Geoportail France
- bounds
- [[41.1779, -5.68494], [51.1827, 10.8556]]
- min_zoom
- 0
- max_zoom
- 12
- apikey
- clc
- format
- image/png
- style
- CORINE Land Cover - France métropolitaine
- variant
- LANDCOVER.GRID.CLC06_FR
- TileMatrixSet
- PM
-
xyzservices.TileProviderGeoportailFrance.Landcover_Grid_Clc12
- url
- https://wxs.ign.fr/{apikey}/geoportail/wmts?REQUEST=GetTile&SERVICE=WMTS&VERSION=1.0.0&STYLE={style}&TILEMATRIXSET={TileMatrixSet}&FORMAT={format}&LAYER={variant}&TILEMATRIX={z}&TILEROW={y}&TILECOL={x}
- html_attribution
- Geoportail France
- attribution
- Geoportail France
- bounds
- [[-21.4825, -61.9063], [51.2963, 55.9362]]
- min_zoom
- 0
- max_zoom
- 13
- apikey
- clc
- format
- image/png
- style
- CORINE Land Cover
- variant
- LANDCOVER.GRID.CLC12
- TileMatrixSet
- PM
-
xyzservices.TileProviderGeoportailFrance.Landcover_Grid_Clc90_fr
- url
- https://wxs.ign.fr/{apikey}/geoportail/wmts?REQUEST=GetTile&SERVICE=WMTS&VERSION=1.0.0&STYLE={style}&TILEMATRIXSET={TileMatrixSet}&FORMAT={format}&LAYER={variant}&TILEMATRIX={z}&TILEROW={y}&TILECOL={x}
- html_attribution
- Geoportail France
- attribution
- Geoportail France
- bounds
- [[41.1779, -5.68494], [51.1827, 10.8556]]
- min_zoom
- 0
- max_zoom
- 13
- apikey
- clc
- format
- image/png
- style
- CORINE Land Cover - France métropolitaine
- variant
- LANDCOVER.GRID.CLC90_FR
- TileMatrixSet
- PM
-
xyzservices.TileProviderGeoportailFrance.Landcover_Hr_Dlt_Clc12
- url
- https://wxs.ign.fr/{apikey}/geoportail/wmts?REQUEST=GetTile&SERVICE=WMTS&VERSION=1.0.0&STYLE={style}&TILEMATRIXSET={TileMatrixSet}&FORMAT={format}&LAYER={variant}&TILEMATRIX={z}&TILEROW={y}&TILECOL={x}
- html_attribution
- Geoportail France
- attribution
- Geoportail France
- bounds
- [[-21.572, -62.3602], [51.4949, 55.8441]]
- min_zoom
- 0
- max_zoom
- 13
- apikey
- clc
- format
- image/png
- style
- CORINE Land Cover - HR - type de forêts
- variant
- LANDCOVER.HR.DLT.CLC12
- TileMatrixSet
- PM
-
xyzservices.TileProviderGeoportailFrance.Landcover_Hr_Dlt_Clc15
- url
- https://wxs.ign.fr/{apikey}/geoportail/wmts?REQUEST=GetTile&SERVICE=WMTS&VERSION=1.0.0&STYLE={style}&TILEMATRIXSET={TileMatrixSet}&FORMAT={format}&LAYER={variant}&TILEMATRIX={z}&TILEROW={y}&TILECOL={x}
- html_attribution
- Geoportail France
- attribution
- Geoportail France
- bounds
- [[-21.572, -62.3602], [51.4949, 55.8441]]
- min_zoom
- 0
- max_zoom
- 13
- apikey
- clc
- format
- image/png
- style
- CORINE Land Cover - HR - type de forêts
- variant
- LANDCOVER.HR.DLT.CLC15
- TileMatrixSet
- PM
-
xyzservices.TileProviderGeoportailFrance.Landcover_Hr_Gra_Clc15
- url
- https://wxs.ign.fr/{apikey}/geoportail/wmts?REQUEST=GetTile&SERVICE=WMTS&VERSION=1.0.0&STYLE={style}&TILEMATRIXSET={TileMatrixSet}&FORMAT={format}&LAYER={variant}&TILEMATRIX={z}&TILEROW={y}&TILECOL={x}
- html_attribution
- Geoportail France
- attribution
- Geoportail France
- bounds
- [[-21.3925, -61.8133], [51.4949, 55.84]]
- min_zoom
- 0
- max_zoom
- 13
- apikey
- clc
- format
- image/png
- style
- CORINE Land Cover - HR - prairies
- variant
- LANDCOVER.HR.GRA.CLC15
- TileMatrixSet
- PM
-
xyzservices.TileProviderGeoportailFrance.Landcover_Hr_Imd_Clc12
- url
- https://wxs.ign.fr/{apikey}/geoportail/wmts?REQUEST=GetTile&SERVICE=WMTS&VERSION=1.0.0&STYLE={style}&TILEMATRIXSET={TileMatrixSet}&FORMAT={format}&LAYER={variant}&TILEMATRIX={z}&TILEROW={y}&TILECOL={x}
- html_attribution
- Geoportail France
- attribution
- Geoportail France
- bounds
- [[-21.5758, -62.3609], [51.4952, 56.1791]]
- min_zoom
- 0
- max_zoom
- 13
- apikey
- clc
- format
- image/png
- style
- CORINE Land Cover - HR - taux d'imperméabilisation des sols
- variant
- LANDCOVER.HR.IMD.CLC12
- TileMatrixSet
- PM
-
xyzservices.TileProviderGeoportailFrance.Landcover_Hr_Imd_Clc15
- url
- https://wxs.ign.fr/{apikey}/geoportail/wmts?REQUEST=GetTile&SERVICE=WMTS&VERSION=1.0.0&STYLE={style}&TILEMATRIXSET={TileMatrixSet}&FORMAT={format}&LAYER={variant}&TILEMATRIX={z}&TILEROW={y}&TILECOL={x}
- html_attribution
- Geoportail France
- attribution
- Geoportail France
- bounds
- [[-21.5758, -62.3609], [51.4952, 56.1791]]
- min_zoom
- 0
- max_zoom
- 13
- apikey
- clc
- format
- image/png
- style
- CORINE Land Cover - HR - taux d'imperméabilisation des sols
- variant
- LANDCOVER.HR.IMD.CLC15
- TileMatrixSet
- PM
-
xyzservices.TileProviderGeoportailFrance.Landcover_Hr_Tcd_Clc12
- url
- https://wxs.ign.fr/{apikey}/geoportail/wmts?REQUEST=GetTile&SERVICE=WMTS&VERSION=1.0.0&STYLE={style}&TILEMATRIXSET={TileMatrixSet}&FORMAT={format}&LAYER={variant}&TILEMATRIX={z}&TILEROW={y}&TILECOL={x}
- html_attribution
- Geoportail France
- attribution
- Geoportail France
- bounds
- [[-21.572, -62.3602], [51.4949, 55.8441]]
- min_zoom
- 0
- max_zoom
- 13
- apikey
- clc
- format
- image/png
- style
- CORINE Land Cover - HR - taux de couvert arboré
- variant
- LANDCOVER.HR.TCD.CLC12
- TileMatrixSet
- PM
-
xyzservices.TileProviderGeoportailFrance.Landcover_Hr_Tcd_Clc15
- url
- https://wxs.ign.fr/{apikey}/geoportail/wmts?REQUEST=GetTile&SERVICE=WMTS&VERSION=1.0.0&STYLE={style}&TILEMATRIXSET={TileMatrixSet}&FORMAT={format}&LAYER={variant}&TILEMATRIX={z}&TILEROW={y}&TILECOL={x}
- html_attribution
- Geoportail France
- attribution
- Geoportail France
- bounds
- [[-21.572, -62.3602], [51.4949, 55.8441]]
- min_zoom
- 0
- max_zoom
- 13
- apikey
- clc
- format
- image/png
- style
- CORINE Land Cover - HR - taux de couvert arboré
- variant
- LANDCOVER.HR.TCD.CLC15
- TileMatrixSet
- PM
-
xyzservices.TileProviderGeoportailFrance.Landcover_Hr_Waw_Clc15
- url
- https://wxs.ign.fr/{apikey}/geoportail/wmts?REQUEST=GetTile&SERVICE=WMTS&VERSION=1.0.0&STYLE={style}&TILEMATRIXSET={TileMatrixSet}&FORMAT={format}&LAYER={variant}&TILEMATRIX={z}&TILEROW={y}&TILECOL={x}
- html_attribution
- Geoportail France
- attribution
- Geoportail France
- bounds
- [[-21.572, -62.3602], [51.4949, 55.8441]]
- min_zoom
- 0
- max_zoom
- 13
- apikey
- clc
- format
- image/png
- style
- CORINE Land Cover - HR - zones humides et surfaces en eaux permanentes
- variant
- LANDCOVER.HR.WAW.CLC15
- TileMatrixSet
- PM
-
xyzservices.TileProviderGeoportailFrance.Areamanagement_Zfu
- url
- https://wxs.ign.fr/{apikey}/geoportail/wmts?REQUEST=GetTile&SERVICE=WMTS&VERSION=1.0.0&STYLE={style}&TILEMATRIXSET={TileMatrixSet}&FORMAT={format}&LAYER={variant}&TILEMATRIX={z}&TILEROW={y}&TILECOL={x}
- html_attribution
- Geoportail France
- attribution
- Geoportail France
- bounds
- [[-21.4756, -63.3725], [51.3121, 55.9259]]
- min_zoom
- 6
- max_zoom
- 16
- apikey
- economie
- format
- image/png
- style
- normal
- variant
- AREAMANAGEMENT.ZFU
- TileMatrixSet
- PM
-
xyzservices.TileProviderGeoportailFrance.Areamanagement_Zus
- url
- https://wxs.ign.fr/{apikey}/geoportail/wmts?REQUEST=GetTile&SERVICE=WMTS&VERSION=1.0.0&STYLE={style}&TILEMATRIXSET={TileMatrixSet}&FORMAT={format}&LAYER={variant}&TILEMATRIX={z}&TILEROW={y}&TILECOL={x}
- html_attribution
- Geoportail France
- attribution
- Geoportail France
- bounds
- [[-21.4756, -63.3725], [51.3121, 55.9259]]
- min_zoom
- 6
- max_zoom
- 16
- apikey
- economie
- format
- image/png
- style
- normal
- variant
- AREAMANAGEMENT.ZUS
- TileMatrixSet
- PM
-
xyzservices.TileProviderGeoportailFrance.Communes_Prioritydisctrict
- url
- https://wxs.ign.fr/{apikey}/geoportail/wmts?REQUEST=GetTile&SERVICE=WMTS&VERSION=1.0.0&STYLE={style}&TILEMATRIXSET={TileMatrixSet}&FORMAT={format}&LAYER={variant}&TILEMATRIX={z}&TILEROW={y}&TILECOL={x}
- html_attribution
- Geoportail France
- attribution
- Geoportail France
- bounds
- [[-21.4756, -63.3725], [51.3121, 55.9259]]
- min_zoom
- 6
- max_zoom
- 17
- apikey
- economie
- format
- image/png
- style
- normal
- variant
- COMMUNES.PRIORITYDISCTRICT
- TileMatrixSet
- PM
-
xyzservices.TileProviderGeoportailFrance.Dreal_Zonage_pinel
- url
- https://wxs.ign.fr/{apikey}/geoportail/wmts?REQUEST=GetTile&SERVICE=WMTS&VERSION=1.0.0&STYLE={style}&TILEMATRIXSET={TileMatrixSet}&FORMAT={format}&LAYER={variant}&TILEMATRIX={z}&TILEROW={y}&TILECOL={x}
- html_attribution
- Geoportail France
- attribution
- Geoportail France
- bounds
- [[47.2719, -5.15012], [48.9064, -1.00687]]
- min_zoom
- 6
- max_zoom
- 18
- apikey
- economie
- format
- image/png
- style
- normal
- variant
- DREAL.ZONAGE_PINEL
- TileMatrixSet
- PM
-
xyzservices.TileProviderGeoportailFrance.Insee_Filosofi_Enfants_0_17_Ans_Secret
- url
- https://wxs.ign.fr/{apikey}/geoportail/wmts?REQUEST=GetTile&SERVICE=WMTS&VERSION=1.0.0&STYLE={style}&TILEMATRIXSET={TileMatrixSet}&FORMAT={format}&LAYER={variant}&TILEMATRIX={z}&TILEROW={y}&TILECOL={x}
- html_attribution
- Geoportail France
- attribution
- Geoportail France
- bounds
- [[-21.4756, -63.3725], [51.3121, 55.9259]]
- min_zoom
- 6
- max_zoom
- 16
- apikey
- economie
- format
- image/png
- style
- INSEE
- variant
- INSEE.FILOSOFI.ENFANTS.0.17.ANS.SECRET
- TileMatrixSet
- PM
-
xyzservices.TileProviderGeoportailFrance.Insee_Filosofi_Logements_Surface_Moyenne_Secret
- url
- https://wxs.ign.fr/{apikey}/geoportail/wmts?REQUEST=GetTile&SERVICE=WMTS&VERSION=1.0.0&STYLE={style}&TILEMATRIXSET={TileMatrixSet}&FORMAT={format}&LAYER={variant}&TILEMATRIX={z}&TILEROW={y}&TILECOL={x}
- html_attribution
- Geoportail France
- attribution
- Geoportail France
- bounds
- [[-21.4756, -63.3725], [51.3121, 55.9259]]
- min_zoom
- 6
- max_zoom
- 16
- apikey
- economie
- format
- image/png
- style
- INSEE
- variant
- INSEE.FILOSOFI.LOGEMENTS.SURFACE.MOYENNE.SECRET
- TileMatrixSet
- PM
-
xyzservices.TileProviderGeoportailFrance.Insee_Filosofi_Niveau_De_Vie_Secret
- url
- https://wxs.ign.fr/{apikey}/geoportail/wmts?REQUEST=GetTile&SERVICE=WMTS&VERSION=1.0.0&STYLE={style}&TILEMATRIXSET={TileMatrixSet}&FORMAT={format}&LAYER={variant}&TILEMATRIX={z}&TILEROW={y}&TILECOL={x}
- html_attribution
- Geoportail France
- attribution
- Geoportail France
- bounds
- [[-21.4756, -63.3725], [51.3121, 55.9259]]
- min_zoom
- 6
- max_zoom
- 16
- apikey
- economie
- format
- image/png
- style
- INSEE
- variant
- INSEE.FILOSOFI.NIVEAU.DE.VIE.SECRET
- TileMatrixSet
- PM
-
xyzservices.TileProviderGeoportailFrance.Insee_Filosofi_Part_Familles_Monoparentales_Secret
- url
- https://wxs.ign.fr/{apikey}/geoportail/wmts?REQUEST=GetTile&SERVICE=WMTS&VERSION=1.0.0&STYLE={style}&TILEMATRIXSET={TileMatrixSet}&FORMAT={format}&LAYER={variant}&TILEMATRIX={z}&TILEROW={y}&TILECOL={x}
- html_attribution
- Geoportail France
- attribution
- Geoportail France
- bounds
- [[-21.4756, -63.3725], [51.3121, 55.9259]]
- min_zoom
- 6
- max_zoom
- 16
- apikey
- economie
- format
- image/png
- style
- INSEE
- variant
- INSEE.FILOSOFI.PART.FAMILLES.MONOPARENTALES.SECRET
- TileMatrixSet
- PM
-
xyzservices.TileProviderGeoportailFrance.Insee_Filosofi_Part_Individus_25_39_Ans_Secret
- url
- https://wxs.ign.fr/{apikey}/geoportail/wmts?REQUEST=GetTile&SERVICE=WMTS&VERSION=1.0.0&STYLE={style}&TILEMATRIXSET={TileMatrixSet}&FORMAT={format}&LAYER={variant}&TILEMATRIX={z}&TILEROW={y}&TILECOL={x}
- html_attribution
- Geoportail France
- attribution
- Geoportail France
- bounds
- [[-21.4756, -63.3725], [51.3121, 55.9259]]
- min_zoom
- 6
- max_zoom
- 16
- apikey
- economie
- format
- image/png
- style
- INSEE
- variant
- INSEE.FILOSOFI.PART.INDIVIDUS.25.39.ANS.SECRET
- TileMatrixSet
- PM
-
xyzservices.TileProviderGeoportailFrance.Insee_Filosofi_Part_Individus_40_54_Ans_Secret
- url
- https://wxs.ign.fr/{apikey}/geoportail/wmts?REQUEST=GetTile&SERVICE=WMTS&VERSION=1.0.0&STYLE={style}&TILEMATRIXSET={TileMatrixSet}&FORMAT={format}&LAYER={variant}&TILEMATRIX={z}&TILEROW={y}&TILECOL={x}
- html_attribution
- Geoportail France
- attribution
- Geoportail France
- bounds
- [[-21.4756, -63.3725], [51.3121, 55.9259]]
- min_zoom
- 6
- max_zoom
- 16
- apikey
- economie
- format
- image/png
- style
- INSEE
- variant
- INSEE.FILOSOFI.PART.INDIVIDUS.40.54.ANS.SECRET
- TileMatrixSet
- PM
-
xyzservices.TileProviderGeoportailFrance.Insee_Filosofi_Part_Individus_55_64_Ans_Secret
- url
- https://wxs.ign.fr/{apikey}/geoportail/wmts?REQUEST=GetTile&SERVICE=WMTS&VERSION=1.0.0&STYLE={style}&TILEMATRIXSET={TileMatrixSet}&FORMAT={format}&LAYER={variant}&TILEMATRIX={z}&TILEROW={y}&TILECOL={x}
- html_attribution
- Geoportail France
- attribution
- Geoportail France
- bounds
- [[-21.4756, -63.3725], [51.3121, 55.9259]]
- min_zoom
- 6
- max_zoom
- 16
- apikey
- economie
- format
- image/png
- style
- INSEE
- variant
- INSEE.FILOSOFI.PART.INDIVIDUS.55.64.ANS.SECRET
- TileMatrixSet
- PM
-
xyzservices.TileProviderGeoportailFrance.Insee_Filosofi_Part_Logements_Apres_1990_Secret
- url
- https://wxs.ign.fr/{apikey}/geoportail/wmts?REQUEST=GetTile&SERVICE=WMTS&VERSION=1.0.0&STYLE={style}&TILEMATRIXSET={TileMatrixSet}&FORMAT={format}&LAYER={variant}&TILEMATRIX={z}&TILEROW={y}&TILECOL={x}
- html_attribution
- Geoportail France
- attribution
- Geoportail France
- bounds
- [[-21.4756, -63.3725], [51.3121, 55.9259]]
- min_zoom
- 6
- max_zoom
- 16
- apikey
- economie
- format
- image/png
- style
- INSEE
- variant
- INSEE.FILOSOFI.PART.LOGEMENTS.APRES.1990.SECRET
- TileMatrixSet
- PM
-
xyzservices.TileProviderGeoportailFrance.Insee_Filosofi_Part_Logements_Avant_1945_Secret
- url
- https://wxs.ign.fr/{apikey}/geoportail/wmts?REQUEST=GetTile&SERVICE=WMTS&VERSION=1.0.0&STYLE={style}&TILEMATRIXSET={TileMatrixSet}&FORMAT={format}&LAYER={variant}&TILEMATRIX={z}&TILEROW={y}&TILECOL={x}
- html_attribution
- Geoportail France
- attribution
- Geoportail France
- bounds
- [[-21.4756, -63.3725], [51.3121, 55.9259]]
- min_zoom
- 6
- max_zoom
- 16
- apikey
- economie
- format
- image/png
- style
- INSEE
- variant
- INSEE.FILOSOFI.PART.LOGEMENTS.AVANT.1945.SECRET
- TileMatrixSet
- PM
-
xyzservices.TileProviderGeoportailFrance.Insee_Filosofi_Part_Logements_Collectifs_Secret
- url
- https://wxs.ign.fr/{apikey}/geoportail/wmts?REQUEST=GetTile&SERVICE=WMTS&VERSION=1.0.0&STYLE={style}&TILEMATRIXSET={TileMatrixSet}&FORMAT={format}&LAYER={variant}&TILEMATRIX={z}&TILEROW={y}&TILECOL={x}
- html_attribution
- Geoportail France
- attribution
- Geoportail France
- bounds
- [[-21.4756, -63.3725], [51.3121, 55.9259]]
- min_zoom
- 6
- max_zoom
- 16
- apikey
- economie
- format
- image/png
- style
- INSEE
- variant
- INSEE.FILOSOFI.PART.LOGEMENTS.COLLECTIFS.SECRET
- TileMatrixSet
- PM
-
xyzservices.TileProviderGeoportailFrance.Insee_Filosofi_Part_Logements_Construits_1945_1970_Secret
- url
- https://wxs.ign.fr/{apikey}/geoportail/wmts?REQUEST=GetTile&SERVICE=WMTS&VERSION=1.0.0&STYLE={style}&TILEMATRIXSET={TileMatrixSet}&FORMAT={format}&LAYER={variant}&TILEMATRIX={z}&TILEROW={y}&TILECOL={x}
- html_attribution
- Geoportail France
- attribution
- Geoportail France
- bounds
- [[-21.4756, -63.3725], [51.3121, 55.9259]]
- min_zoom
- 6
- max_zoom
- 16
- apikey
- economie
- format
- image/png
- style
- INSEE
- variant
- INSEE.FILOSOFI.PART.LOGEMENTS.CONSTRUITS.1945.1970.SECRET
- TileMatrixSet
- PM
-
xyzservices.TileProviderGeoportailFrance.Insee_Filosofi_Part_Logements_Construits_1970_1990_Secret
- url
- https://wxs.ign.fr/{apikey}/geoportail/wmts?REQUEST=GetTile&SERVICE=WMTS&VERSION=1.0.0&STYLE={style}&TILEMATRIXSET={TileMatrixSet}&FORMAT={format}&LAYER={variant}&TILEMATRIX={z}&TILEROW={y}&TILECOL={x}
- html_attribution
- Geoportail France
- attribution
- Geoportail France
- bounds
- [[-21.4756, -63.3725], [51.3121, 55.9259]]
- min_zoom
- 6
- max_zoom
- 16
- apikey
- economie
- format
- image/png
- style
- INSEE
- variant
- INSEE.FILOSOFI.PART.LOGEMENTS.CONSTRUITS.1970.1990.SECRET
- TileMatrixSet
- PM
-
xyzservices.TileProviderGeoportailFrance.Insee_Filosofi_Part_Logements_Sociaux_Secret
- url
- https://wxs.ign.fr/{apikey}/geoportail/wmts?REQUEST=GetTile&SERVICE=WMTS&VERSION=1.0.0&STYLE={style}&TILEMATRIXSET={TileMatrixSet}&FORMAT={format}&LAYER={variant}&TILEMATRIX={z}&TILEROW={y}&TILECOL={x}
- html_attribution
- Geoportail France
- attribution
- Geoportail France
- bounds
- [[-21.4756, -63.3725], [51.3121, 55.9259]]
- min_zoom
- 6
- max_zoom
- 16
- apikey
- economie
- format
- image/png
- style
- INSEE
- variant
- INSEE.FILOSOFI.PART.LOGEMENTS.SOCIAUX.SECRET
- TileMatrixSet
- PM
-
xyzservices.TileProviderGeoportailFrance.Insee_Filosofi_Part_Menages_1_Personne_Secret
- url
- https://wxs.ign.fr/{apikey}/geoportail/wmts?REQUEST=GetTile&SERVICE=WMTS&VERSION=1.0.0&STYLE={style}&TILEMATRIXSET={TileMatrixSet}&FORMAT={format}&LAYER={variant}&TILEMATRIX={z}&TILEROW={y}&TILECOL={x}
- html_attribution
- Geoportail France
- attribution
- Geoportail France
- bounds
- [[-21.4756, -63.3725], [51.3121, 55.9259]]
- min_zoom
- 6
- max_zoom
- 16
- apikey
- economie
- format
- image/png
- style
- INSEE
- variant
- INSEE.FILOSOFI.PART.MENAGES.1.PERSONNE.SECRET
- TileMatrixSet
- PM
-
xyzservices.TileProviderGeoportailFrance.Insee_Filosofi_Part_Menages_5_Personnes_Ouplus_Secret
- url
- https://wxs.ign.fr/{apikey}/geoportail/wmts?REQUEST=GetTile&SERVICE=WMTS&VERSION=1.0.0&STYLE={style}&TILEMATRIXSET={TileMatrixSet}&FORMAT={format}&LAYER={variant}&TILEMATRIX={z}&TILEROW={y}&TILECOL={x}
- html_attribution
- Geoportail France
- attribution
- Geoportail France
- bounds
- [[-21.4756, -63.3725], [51.3121, 55.9259]]
- min_zoom
- 6
- max_zoom
- 16
- apikey
- economie
- format
- image/png
- style
- INSEE
- variant
- INSEE.FILOSOFI.PART.MENAGES.5.PERSONNES.OUPLUS.SECRET
- TileMatrixSet
- PM
-
xyzservices.TileProviderGeoportailFrance.Insee_Filosofi_Part_Menages_Maison_Secret
- url
- https://wxs.ign.fr/{apikey}/geoportail/wmts?REQUEST=GetTile&SERVICE=WMTS&VERSION=1.0.0&STYLE={style}&TILEMATRIXSET={TileMatrixSet}&FORMAT={format}&LAYER={variant}&TILEMATRIX={z}&TILEROW={y}&TILECOL={x}
- html_attribution
- Geoportail France
- attribution
- Geoportail France
- bounds
- [[-21.4756, -63.3725], [51.3121, 55.9259]]
- min_zoom
- 6
- max_zoom
- 16
- apikey
- economie
- format
- image/png
- style
- INSEE
- variant
- INSEE.FILOSOFI.PART.MENAGES.MAISON.SECRET
- TileMatrixSet
- PM
-
xyzservices.TileProviderGeoportailFrance.Insee_Filosofi_Part_Menages_Pauvres_Secret
- url
- https://wxs.ign.fr/{apikey}/geoportail/wmts?REQUEST=GetTile&SERVICE=WMTS&VERSION=1.0.0&STYLE={style}&TILEMATRIXSET={TileMatrixSet}&FORMAT={format}&LAYER={variant}&TILEMATRIX={z}&TILEROW={y}&TILECOL={x}
- html_attribution
- Geoportail France
- attribution
- Geoportail France
- bounds
- [[-21.4756, -63.3725], [51.3121, 55.9259]]
- min_zoom
- 6
- max_zoom
- 16
- apikey
- economie
- format
- image/png
- style
- INSEE
- variant
- INSEE.FILOSOFI.PART.MENAGES.PAUVRES.SECRET
- TileMatrixSet
- PM
-
xyzservices.TileProviderGeoportailFrance.Insee_Filosofi_Part_Menages_Proprietaires_Secret
- url
- https://wxs.ign.fr/{apikey}/geoportail/wmts?REQUEST=GetTile&SERVICE=WMTS&VERSION=1.0.0&STYLE={style}&TILEMATRIXSET={TileMatrixSet}&FORMAT={format}&LAYER={variant}&TILEMATRIX={z}&TILEROW={y}&TILECOL={x}
- html_attribution
- Geoportail France
- attribution
- Geoportail France
- bounds
- [[-21.4756, -63.3725], [51.3121, 55.9259]]
- min_zoom
- 6
- max_zoom
- 16
- apikey
- economie
- format
- image/png
- style
- INSEE
- variant
- INSEE.FILOSOFI.PART.MENAGES.PROPRIETAIRES.SECRET
- TileMatrixSet
- PM
-
xyzservices.TileProviderGeoportailFrance.Insee_Filosofi_Part_Plus_65_Ans_Secret
- url
- https://wxs.ign.fr/{apikey}/geoportail/wmts?REQUEST=GetTile&SERVICE=WMTS&VERSION=1.0.0&STYLE={style}&TILEMATRIXSET={TileMatrixSet}&FORMAT={format}&LAYER={variant}&TILEMATRIX={z}&TILEROW={y}&TILECOL={x}
- html_attribution
- Geoportail France
- attribution
- Geoportail France
- bounds
- [[-21.4756, -63.3725], [51.3121, 55.9259]]
- min_zoom
- 6
- max_zoom
- 16
- apikey
- economie
- format
- image/png
- style
- INSEE
- variant
- INSEE.FILOSOFI.PART.PLUS.65.ANS.SECRET
- TileMatrixSet
- PM
-
xyzservices.TileProviderGeoportailFrance.Insee_Filosofi_Population
- url
- https://wxs.ign.fr/{apikey}/geoportail/wmts?REQUEST=GetTile&SERVICE=WMTS&VERSION=1.0.0&STYLE={style}&TILEMATRIXSET={TileMatrixSet}&FORMAT={format}&LAYER={variant}&TILEMATRIX={z}&TILEROW={y}&TILECOL={x}
- html_attribution
- Geoportail France
- attribution
- Geoportail France
- bounds
- [[-21.4756, -63.3725], [51.3121, 55.9259]]
- min_zoom
- 6
- max_zoom
- 16
- apikey
- economie
- format
- image/png
- style
- INSEE
- variant
- INSEE.FILOSOFI.POPULATION
- TileMatrixSet
- PM
-
xyzservices.TileProviderGeoportailFrance.Debroussaillement
- url
- https://wxs.ign.fr/{apikey}/geoportail/wmts?REQUEST=GetTile&SERVICE=WMTS&VERSION=1.0.0&STYLE={style}&TILEMATRIXSET={TileMatrixSet}&FORMAT={format}&LAYER={variant}&TILEMATRIX={z}&TILEROW={y}&TILECOL={x}
- html_attribution
- Geoportail France
- attribution
- Geoportail France
- bounds
- [[41.3252, -5.15047], [51.0991, 9.57054]]
- min_zoom
- 6
- max_zoom
- 18
- apikey
- environnement
- format
- image/png
- style
- nolegend
- variant
- DEBROUSSAILLEMENT
- TileMatrixSet
- PM
-
xyzservices.TileProviderGeoportailFrance.Forets_Publiques
- url
- https://wxs.ign.fr/{apikey}/geoportail/wmts?REQUEST=GetTile&SERVICE=WMTS&VERSION=1.0.0&STYLE={style}&TILEMATRIXSET={TileMatrixSet}&FORMAT={format}&LAYER={variant}&TILEMATRIX={z}&TILEROW={y}&TILECOL={x}
- html_attribution
- Geoportail France
- attribution
- Geoportail France
- bounds
- [[-21.4756, -63.3725], [51.3121, 55.9259]]
- min_zoom
- 3
- max_zoom
- 16
- apikey
- environnement
- format
- image/png
- style
- FORETS PUBLIQUES ONF
- variant
- FORETS.PUBLIQUES
- TileMatrixSet
- PM
-
xyzservices.TileProviderGeoportailFrance.Geographicalgridsystem_Dfci
- url
- https://wxs.ign.fr/{apikey}/geoportail/wmts?REQUEST=GetTile&SERVICE=WMTS&VERSION=1.0.0&STYLE={style}&TILEMATRIXSET={TileMatrixSet}&FORMAT={format}&LAYER={variant}&TILEMATRIX={z}&TILEROW={y}&TILECOL={x}
- html_attribution
- Geoportail France
- attribution
- Geoportail France
- bounds
- [[41.3252, -5.15047], [51.0991, 9.57054]]
- min_zoom
- 6
- max_zoom
- 16
- apikey
- environnement
- format
- image/png
- style
- normal
- variant
- GEOGRAPHICALGRIDSYSTEM.DFCI
- TileMatrixSet
- PM
-
xyzservices.TileProviderGeoportailFrance.Landcover_Forestareas
- url
- https://wxs.ign.fr/{apikey}/geoportail/wmts?REQUEST=GetTile&SERVICE=WMTS&VERSION=1.0.0&STYLE={style}&TILEMATRIXSET={TileMatrixSet}&FORMAT={format}&LAYER={variant}&TILEMATRIX={z}&TILEROW={y}&TILECOL={x}
- html_attribution
- Geoportail France
- attribution
- Geoportail France
- bounds
- [[41.3252, -5.15047], [51.0991, 9.57054]]
- min_zoom
- 6
- max_zoom
- 16
- apikey
- environnement
- format
- image/png
- style
- normal
- variant
- LANDCOVER.FORESTAREAS
- TileMatrixSet
- PM
-
xyzservices.TileProviderGeoportailFrance.Landcover_Forestinventory_V1
- url
- https://wxs.ign.fr/{apikey}/geoportail/wmts?REQUEST=GetTile&SERVICE=WMTS&VERSION=1.0.0&STYLE={style}&TILEMATRIXSET={TileMatrixSet}&FORMAT={format}&LAYER={variant}&TILEMATRIX={z}&TILEROW={y}&TILECOL={x}
- html_attribution
- Geoportail France
- attribution
- Geoportail France
- bounds
- [[41.3252, -5.15047], [51.0991, 9.57054]]
- min_zoom
- 6
- max_zoom
- 16
- apikey
- environnement
- format
- image/png
- style
- normal
- variant
- LANDCOVER.FORESTINVENTORY.V1
- TileMatrixSet
- PM
-
xyzservices.TileProviderGeoportailFrance.Landcover_Forestinventory_V2
- url
- https://wxs.ign.fr/{apikey}/geoportail/wmts?REQUEST=GetTile&SERVICE=WMTS&VERSION=1.0.0&STYLE={style}&TILEMATRIXSET={TileMatrixSet}&FORMAT={format}&LAYER={variant}&TILEMATRIX={z}&TILEROW={y}&TILECOL={x}
- html_attribution
- Geoportail France
- attribution
- Geoportail France
- bounds
- [[41.3252, -5.15047], [51.0991, 9.57054]]
- min_zoom
- 6
- max_zoom
- 16
- apikey
- environnement
- format
- image/png
- style
- normal
- variant
- LANDCOVER.FORESTINVENTORY.V2
- TileMatrixSet
- PM
-
xyzservices.TileProviderGeoportailFrance.Landcover_Sylvoecoregions
- url
- https://wxs.ign.fr/{apikey}/geoportail/wmts?REQUEST=GetTile&SERVICE=WMTS&VERSION=1.0.0&STYLE={style}&TILEMATRIXSET={TileMatrixSet}&FORMAT={format}&LAYER={variant}&TILEMATRIX={z}&TILEROW={y}&TILECOL={x}
- html_attribution
- Geoportail France
- attribution
- Geoportail France
- bounds
- [[41.3252, -5.15047], [51.0991, 9.57054]]
- min_zoom
- 6
- max_zoom
- 16
- apikey
- environnement
- format
- image/png
- style
- normal
- variant
- LANDCOVER.SYLVOECOREGIONS
- TileMatrixSet
- PM
-
xyzservices.TileProviderGeoportailFrance.Landcover_Sylvoecoregions_Alluvium
- url
- https://wxs.ign.fr/{apikey}/geoportail/wmts?REQUEST=GetTile&SERVICE=WMTS&VERSION=1.0.0&STYLE={style}&TILEMATRIXSET={TileMatrixSet}&FORMAT={format}&LAYER={variant}&TILEMATRIX={z}&TILEROW={y}&TILECOL={x}
- html_attribution
- Geoportail France
- attribution
- Geoportail France
- bounds
- [[41.3252, -5.15047], [51.0991, 9.57054]]
- min_zoom
- 6
- max_zoom
- 16
- apikey
- environnement
- format
- image/png
- style
- normal
- variant
- LANDCOVER.SYLVOECOREGIONS.ALLUVIUM
- TileMatrixSet
- PM
-
xyzservices.TileProviderGeoportailFrance.Protectedareas_Apb
- url
- https://wxs.ign.fr/{apikey}/geoportail/wmts?REQUEST=GetTile&SERVICE=WMTS&VERSION=1.0.0&STYLE={style}&TILEMATRIXSET={TileMatrixSet}&FORMAT={format}&LAYER={variant}&TILEMATRIX={z}&TILEROW={y}&TILECOL={x}
- html_attribution
- Geoportail France
- attribution
- Geoportail France
- bounds
- [[-21.4756, -63.3725], [51.3121, 55.9259]]
- min_zoom
- 6
- max_zoom
- 16
- apikey
- environnement
- format
- image/png
- style
- normal
- variant
- PROTECTEDAREAS.APB
- TileMatrixSet
- PM
-
xyzservices.TileProviderGeoportailFrance.Protectedareas_Apg
- url
- https://wxs.ign.fr/{apikey}/geoportail/wmts?REQUEST=GetTile&SERVICE=WMTS&VERSION=1.0.0&STYLE={style}&TILEMATRIXSET={TileMatrixSet}&FORMAT={format}&LAYER={variant}&TILEMATRIX={z}&TILEROW={y}&TILECOL={x}
- html_attribution
- Geoportail France
- attribution
- Geoportail France
- bounds
- [[-21.4756, -63.3725], [51.3121, 55.9259]]
- min_zoom
- 6
- max_zoom
- 16
- apikey
- environnement
- format
- image/png
- style
- normal
- variant
- PROTECTEDAREAS.APG
- TileMatrixSet
- PM
-
xyzservices.TileProviderGeoportailFrance.Protectedareas_Aphn
- url
- https://wxs.ign.fr/{apikey}/geoportail/wmts?REQUEST=GetTile&SERVICE=WMTS&VERSION=1.0.0&STYLE={style}&TILEMATRIXSET={TileMatrixSet}&FORMAT={format}&LAYER={variant}&TILEMATRIX={z}&TILEROW={y}&TILECOL={x}
- html_attribution
- Geoportail France
- attribution
- Geoportail France
- bounds
- [[-53.6279, -63.3725], [51.3121, 82.645]]
- min_zoom
- 6
- max_zoom
- 16
- apikey
- environnement
- format
- image/png
- style
- normal
- variant
- PROTECTEDAREAS.APHN
- TileMatrixSet
- PM
-
xyzservices.TileProviderGeoportailFrance.Protectedareas_Aplg
- url
- https://wxs.ign.fr/{apikey}/geoportail/wmts?REQUEST=GetTile&SERVICE=WMTS&VERSION=1.0.0&STYLE={style}&TILEMATRIXSET={TileMatrixSet}&FORMAT={format}&LAYER={variant}&TILEMATRIX={z}&TILEROW={y}&TILECOL={x}
- html_attribution
- Geoportail France
- attribution
- Geoportail France
- bounds
- [[-53.6279, -63.3725], [51.3121, 82.645]]
- min_zoom
- 6
- max_zoom
- 16
- apikey
- environnement
- format
- image/png
- style
- nolegend
- variant
- PROTECTEDAREAS.APLG
- TileMatrixSet
- PM
-
xyzservices.TileProviderGeoportailFrance.Protectedareas_Bios
- url
- https://wxs.ign.fr/{apikey}/geoportail/wmts?REQUEST=GetTile&SERVICE=WMTS&VERSION=1.0.0&STYLE={style}&TILEMATRIXSET={TileMatrixSet}&FORMAT={format}&LAYER={variant}&TILEMATRIX={z}&TILEROW={y}&TILECOL={x}
- html_attribution
- Geoportail France
- attribution
- Geoportail France
- bounds
- [[-21.4756, -63.3725], [51.3121, 55.9259]]
- min_zoom
- 6
- max_zoom
- 16
- apikey
- environnement
- format
- image/png
- style
- normal
- variant
- PROTECTEDAREAS.BIOS
- TileMatrixSet
- PM
-
xyzservices.TileProviderGeoportailFrance.Protectedareas_Gp
- url
- https://wxs.ign.fr/{apikey}/geoportail/wmts?REQUEST=GetTile&SERVICE=WMTS&VERSION=1.0.0&STYLE={style}&TILEMATRIXSET={TileMatrixSet}&FORMAT={format}&LAYER={variant}&TILEMATRIX={z}&TILEROW={y}&TILECOL={x}
- html_attribution
- Geoportail France
- attribution
- Geoportail France
- bounds
- [[-21.4756, -63.3725], [51.3121, 55.9259]]
- min_zoom
- 6
- max_zoom
- 16
- apikey
- environnement
- format
- image/png
- style
- normal
- variant
- PROTECTEDAREAS.GP
- TileMatrixSet
- PM
-
xyzservices.TileProviderGeoportailFrance.Protectedareas_Inpg
- url
- https://wxs.ign.fr/{apikey}/geoportail/wmts?REQUEST=GetTile&SERVICE=WMTS&VERSION=1.0.0&STYLE={style}&TILEMATRIXSET={TileMatrixSet}&FORMAT={format}&LAYER={variant}&TILEMATRIX={z}&TILEROW={y}&TILECOL={x}
- html_attribution
- Geoportail France
- attribution
- Geoportail France
- bounds
- [[-53.6279, -63.3725], [51.3121, 82.645]]
- min_zoom
- 6
- max_zoom
- 16
- apikey
- environnement
- format
- image/png
- style
- normal
- variant
- PROTECTEDAREAS.INPG
- TileMatrixSet
- PM
-
xyzservices.TileProviderGeoportailFrance.Protectedareas_Mnhn_Cdl_Parcels
- url
- https://wxs.ign.fr/{apikey}/geoportail/wmts?REQUEST=GetTile&SERVICE=WMTS&VERSION=1.0.0&STYLE={style}&TILEMATRIXSET={TileMatrixSet}&FORMAT={format}&LAYER={variant}&TILEMATRIX={z}&TILEROW={y}&TILECOL={x}
- html_attribution
- Geoportail France
- attribution
- Geoportail France
- bounds
- [[-21.4756, -63.3725], [51.3121, 55.9259]]
- min_zoom
- 6
- max_zoom
- 16
- apikey
- environnement
- format
- image/png
- style
- normal
- variant
- PROTECTEDAREAS.MNHN.CDL.PARCELS
- TileMatrixSet
- PM
-
xyzservices.TileProviderGeoportailFrance.Protectedareas_Mnhn_Cdl_Perimeter
- url
- https://wxs.ign.fr/{apikey}/geoportail/wmts?REQUEST=GetTile&SERVICE=WMTS&VERSION=1.0.0&STYLE={style}&TILEMATRIXSET={TileMatrixSet}&FORMAT={format}&LAYER={variant}&TILEMATRIX={z}&TILEROW={y}&TILECOL={x}
- html_attribution
- Geoportail France
- attribution
- Geoportail France
- bounds
- [[-21.4756, -63.3725], [51.3121, 55.9259]]
- min_zoom
- 6
- max_zoom
- 16
- apikey
- environnement
- format
- image/png
- style
- normal
- variant
- PROTECTEDAREAS.MNHN.CDL.PERIMETER
- TileMatrixSet
- PM
-
xyzservices.TileProviderGeoportailFrance.Protectedareas_Mnhn_Conservatoires
- url
- https://wxs.ign.fr/{apikey}/geoportail/wmts?REQUEST=GetTile&SERVICE=WMTS&VERSION=1.0.0&STYLE={style}&TILEMATRIXSET={TileMatrixSet}&FORMAT={format}&LAYER={variant}&TILEMATRIX={z}&TILEROW={y}&TILECOL={x}
- html_attribution
- Geoportail France
- attribution
- Geoportail France
- bounds
- [[-21.4756, -63.3725], [51.3121, 55.9259]]
- min_zoom
- 6
- max_zoom
- 16
- apikey
- environnement
- format
- image/png
- style
- normal
- variant
- PROTECTEDAREAS.MNHN.CONSERVATOIRES
- TileMatrixSet
- PM
-
xyzservices.TileProviderGeoportailFrance.Protectedareas_Mnhn_Rn_Perimeter
- url
- https://wxs.ign.fr/{apikey}/geoportail/wmts?REQUEST=GetTile&SERVICE=WMTS&VERSION=1.0.0&STYLE={style}&TILEMATRIXSET={TileMatrixSet}&FORMAT={format}&LAYER={variant}&TILEMATRIX={z}&TILEROW={y}&TILECOL={x}
- html_attribution
- Geoportail France
- attribution
- Geoportail France
- bounds
- [[-53.6279, -63.3725], [51.3121, 82.645]]
- min_zoom
- 0
- max_zoom
- 16
- apikey
- environnement
- format
- image/png
- style
- normal
- variant
- PROTECTEDAREAS.MNHN.RN.PERIMETER
- TileMatrixSet
- PM
-
xyzservices.TileProviderGeoportailFrance.Protectedareas_Pn
- url
- https://wxs.ign.fr/{apikey}/geoportail/wmts?REQUEST=GetTile&SERVICE=WMTS&VERSION=1.0.0&STYLE={style}&TILEMATRIXSET={TileMatrixSet}&FORMAT={format}&LAYER={variant}&TILEMATRIX={z}&TILEROW={y}&TILECOL={x}
- html_attribution
- Geoportail France
- attribution
- Geoportail France
- bounds
- [[-21.4756, -63.3725], [51.3121, 55.9259]]
- min_zoom
- 6
- max_zoom
- 16
- apikey
- environnement
- format
- image/png
- style
- normal
- variant
- PROTECTEDAREAS.PN
- TileMatrixSet
- PM
-
xyzservices.TileProviderGeoportailFrance.Protectedareas_Pnm
- url
- https://wxs.ign.fr/{apikey}/geoportail/wmts?REQUEST=GetTile&SERVICE=WMTS&VERSION=1.0.0&STYLE={style}&TILEMATRIXSET={TileMatrixSet}&FORMAT={format}&LAYER={variant}&TILEMATRIX={z}&TILEROW={y}&TILECOL={x}
- html_attribution
- Geoportail France
- attribution
- Geoportail France
- bounds
- [[-21.4756, -63.3725], [51.3121, 55.9259]]
- min_zoom
- 6
- max_zoom
- 16
- apikey
- environnement
- format
- image/png
- style
- normal
- variant
- PROTECTEDAREAS.PNM
- TileMatrixSet
- PM
-
xyzservices.TileProviderGeoportailFrance.Protectedareas_Pnr
- url
- https://wxs.ign.fr/{apikey}/geoportail/wmts?REQUEST=GetTile&SERVICE=WMTS&VERSION=1.0.0&STYLE={style}&TILEMATRIXSET={TileMatrixSet}&FORMAT={format}&LAYER={variant}&TILEMATRIX={z}&TILEROW={y}&TILECOL={x}
- html_attribution
- Geoportail France
- attribution
- Geoportail France
- bounds
- [[-21.4756, -63.3725], [51.3121, 55.9259]]
- min_zoom
- 6
- max_zoom
- 16
- apikey
- environnement
- format
- image/png
- style
- normal
- variant
- PROTECTEDAREAS.PNR
- TileMatrixSet
- PM
-
xyzservices.TileProviderGeoportailFrance.Protectedareas_Prsf
- url
- https://wxs.ign.fr/{apikey}/geoportail/wmts?REQUEST=GetTile&SERVICE=WMTS&VERSION=1.0.0&STYLE={style}&TILEMATRIXSET={TileMatrixSet}&FORMAT={format}&LAYER={variant}&TILEMATRIX={z}&TILEROW={y}&TILECOL={x}
- html_attribution
- Geoportail France
- attribution
- Geoportail France
- bounds
- [[-21.4756, -63.3725], [51.3121, 55.9259]]
- min_zoom
- 6
- max_zoom
- 17
- apikey
- environnement
- format
- image/png
- style
- POINT RENCONTRE SECOURS FORET
- variant
- PROTECTEDAREAS.PRSF
- TileMatrixSet
- PM
-
xyzservices.TileProviderGeoportailFrance.Protectedareas_Ramsar
- url
- https://wxs.ign.fr/{apikey}/geoportail/wmts?REQUEST=GetTile&SERVICE=WMTS&VERSION=1.0.0&STYLE={style}&TILEMATRIXSET={TileMatrixSet}&FORMAT={format}&LAYER={variant}&TILEMATRIX={z}&TILEROW={y}&TILECOL={x}
- html_attribution
- Geoportail France
- attribution
- Geoportail France
- bounds
- [[-21.4756, -63.3725], [51.3121, 55.9259]]
- min_zoom
- 6
- max_zoom
- 16
- apikey
- environnement
- format
- image/png
- style
- normal
- variant
- PROTECTEDAREAS.RAMSAR
- TileMatrixSet
- PM
-
xyzservices.TileProviderGeoportailFrance.Protectedareas_Rb
- url
- https://wxs.ign.fr/{apikey}/geoportail/wmts?REQUEST=GetTile&SERVICE=WMTS&VERSION=1.0.0&STYLE={style}&TILEMATRIXSET={TileMatrixSet}&FORMAT={format}&LAYER={variant}&TILEMATRIX={z}&TILEROW={y}&TILECOL={x}
- html_attribution
- Geoportail France
- attribution
- Geoportail France
- bounds
- [[-21.4756, -63.3725], [51.3121, 55.9259]]
- min_zoom
- 6
- max_zoom
- 16
- apikey
- environnement
- format
- image/png
- style
- normal
- variant
- PROTECTEDAREAS.RB
- TileMatrixSet
- PM
-
xyzservices.TileProviderGeoportailFrance.Protectedareas_Ripn
- url
- https://wxs.ign.fr/{apikey}/geoportail/wmts?REQUEST=GetTile&SERVICE=WMTS&VERSION=1.0.0&STYLE={style}&TILEMATRIXSET={TileMatrixSet}&FORMAT={format}&LAYER={variant}&TILEMATRIX={z}&TILEROW={y}&TILECOL={x}
- html_attribution
- Geoportail France
- attribution
- Geoportail France
- bounds
- [[-21.4756, -63.3725], [51.3121, 55.9259]]
- min_zoom
- 6
- max_zoom
- 16
- apikey
- environnement
- format
- image/png
- style
- normal
- variant
- PROTECTEDAREAS.RIPN
- TileMatrixSet
- PM
-
xyzservices.TileProviderGeoportailFrance.Protectedareas_Rn
- url
- https://wxs.ign.fr/{apikey}/geoportail/wmts?REQUEST=GetTile&SERVICE=WMTS&VERSION=1.0.0&STYLE={style}&TILEMATRIXSET={TileMatrixSet}&FORMAT={format}&LAYER={variant}&TILEMATRIX={z}&TILEROW={y}&TILECOL={x}
- html_attribution
- Geoportail France
- attribution
- Geoportail France
- bounds
- [[-53.6279, -63.3725], [51.3121, 82.645]]
- min_zoom
- 0
- max_zoom
- 16
- apikey
- environnement
- format
- image/png
- style
- normal
- variant
- PROTECTEDAREAS.RN
- TileMatrixSet
- PM
-
xyzservices.TileProviderGeoportailFrance.Protectedareas_Rnc
- url
- https://wxs.ign.fr/{apikey}/geoportail/wmts?REQUEST=GetTile&SERVICE=WMTS&VERSION=1.0.0&STYLE={style}&TILEMATRIXSET={TileMatrixSet}&FORMAT={format}&LAYER={variant}&TILEMATRIX={z}&TILEROW={y}&TILECOL={x}
- html_attribution
- Geoportail France
- attribution
- Geoportail France
- bounds
- [[-21.4756, -63.3725], [51.3121, 55.9259]]
- min_zoom
- 6
- max_zoom
- 16
- apikey
- environnement
- format
- image/png
- style
- normal
- variant
- PROTECTEDAREAS.RNC
- TileMatrixSet
- PM
-
xyzservices.TileProviderGeoportailFrance.Protectedareas_Rncf
- url
- https://wxs.ign.fr/{apikey}/geoportail/wmts?REQUEST=GetTile&SERVICE=WMTS&VERSION=1.0.0&STYLE={style}&TILEMATRIXSET={TileMatrixSet}&FORMAT={format}&LAYER={variant}&TILEMATRIX={z}&TILEROW={y}&TILECOL={x}
- html_attribution
- Geoportail France
- attribution
- Geoportail France
- bounds
- [[-21.4756, -63.3725], [51.3121, 55.9259]]
- min_zoom
- 6
- max_zoom
- 16
- apikey
- environnement
- format
- image/png
- style
- normal
- variant
- PROTECTEDAREAS.RNCF
- TileMatrixSet
- PM
-
xyzservices.TileProviderGeoportailFrance.Protectedareas_Sic
- url
- https://wxs.ign.fr/{apikey}/geoportail/wmts?REQUEST=GetTile&SERVICE=WMTS&VERSION=1.0.0&STYLE={style}&TILEMATRIXSET={TileMatrixSet}&FORMAT={format}&LAYER={variant}&TILEMATRIX={z}&TILEROW={y}&TILECOL={x}
- html_attribution
- Geoportail France
- attribution
- Geoportail France
- bounds
- [[-21.4756, -63.3725], [51.3121, 55.9259]]
- min_zoom
- 6
- max_zoom
- 16
- apikey
- environnement
- format
- image/png
- style
- normal
- variant
- PROTECTEDAREAS.SIC
- TileMatrixSet
- PM
-
xyzservices.TileProviderGeoportailFrance.Protectedareas_Znieff1
- url
- https://wxs.ign.fr/{apikey}/geoportail/wmts?REQUEST=GetTile&SERVICE=WMTS&VERSION=1.0.0&STYLE={style}&TILEMATRIXSET={TileMatrixSet}&FORMAT={format}&LAYER={variant}&TILEMATRIX={z}&TILEROW={y}&TILECOL={x}
- html_attribution
- Geoportail France
- attribution
- Geoportail France
- bounds
- [[-21.4756, -63.3725], [51.3121, 55.9259]]
- min_zoom
- 6
- max_zoom
- 16
- apikey
- environnement
- format
- image/png
- style
- normal
- variant
- PROTECTEDAREAS.ZNIEFF1
- TileMatrixSet
- PM
-
xyzservices.TileProviderGeoportailFrance.Protectedareas_Znieff1_Sea
- url
- https://wxs.ign.fr/{apikey}/geoportail/wmts?REQUEST=GetTile&SERVICE=WMTS&VERSION=1.0.0&STYLE={style}&TILEMATRIXSET={TileMatrixSet}&FORMAT={format}&LAYER={variant}&TILEMATRIX={z}&TILEROW={y}&TILECOL={x}
- html_attribution
- Geoportail France
- attribution
- Geoportail France
- bounds
- [[-21.4756, -63.3725], [51.3121, 55.9259]]
- min_zoom
- 6
- max_zoom
- 16
- apikey
- environnement
- format
- image/png
- style
- normal
- variant
- PROTECTEDAREAS.ZNIEFF1.SEA
- TileMatrixSet
- PM
-
xyzservices.TileProviderGeoportailFrance.Protectedareas_Znieff2
- url
- https://wxs.ign.fr/{apikey}/geoportail/wmts?REQUEST=GetTile&SERVICE=WMTS&VERSION=1.0.0&STYLE={style}&TILEMATRIXSET={TileMatrixSet}&FORMAT={format}&LAYER={variant}&TILEMATRIX={z}&TILEROW={y}&TILECOL={x}
- html_attribution
- Geoportail France
- attribution
- Geoportail France
- bounds
- [[-21.4756, -63.3725], [51.3121, 55.9259]]
- min_zoom
- 6
- max_zoom
- 16
- apikey
- environnement
- format
- image/png
- style
- normal
- variant
- PROTECTEDAREAS.ZNIEFF2
- TileMatrixSet
- PM
-
xyzservices.TileProviderGeoportailFrance.Protectedareas_Znieff2_Sea
- url
- https://wxs.ign.fr/{apikey}/geoportail/wmts?REQUEST=GetTile&SERVICE=WMTS&VERSION=1.0.0&STYLE={style}&TILEMATRIXSET={TileMatrixSet}&FORMAT={format}&LAYER={variant}&TILEMATRIX={z}&TILEROW={y}&TILECOL={x}
- html_attribution
- Geoportail France
- attribution
- Geoportail France
- bounds
- [[-21.4756, -63.3725], [51.3121, 55.9259]]
- min_zoom
- 6
- max_zoom
- 16
- apikey
- environnement
- format
- image/png
- style
- normal
- variant
- PROTECTEDAREAS.ZNIEFF2.SEA
- TileMatrixSet
- PM
-
xyzservices.TileProviderGeoportailFrance.Protectedareas_Zpr
- url
- https://wxs.ign.fr/{apikey}/geoportail/wmts?REQUEST=GetTile&SERVICE=WMTS&VERSION=1.0.0&STYLE={style}&TILEMATRIXSET={TileMatrixSet}&FORMAT={format}&LAYER={variant}&TILEMATRIX={z}&TILEROW={y}&TILECOL={x}
- html_attribution
- Geoportail France
- attribution
- Geoportail France
- bounds
- [[-53.6279, -63.3725], [51.3121, 82.645]]
- min_zoom
- 6
- max_zoom
- 16
- apikey
- environnement
- format
- image/png
- style
- nolegend
- variant
- PROTECTEDAREAS.ZPR
- TileMatrixSet
- PM
-
xyzservices.TileProviderGeoportailFrance.Protectedareas_Zps
- url
- https://wxs.ign.fr/{apikey}/geoportail/wmts?REQUEST=GetTile&SERVICE=WMTS&VERSION=1.0.0&STYLE={style}&TILEMATRIXSET={TileMatrixSet}&FORMAT={format}&LAYER={variant}&TILEMATRIX={z}&TILEROW={y}&TILECOL={x}
- html_attribution
- Geoportail France
- attribution
- Geoportail France
- bounds
- [[-21.4756, -63.3725], [51.3121, 55.9259]]
- min_zoom
- 6
- max_zoom
- 16
- apikey
- environnement
- format
- image/png
- style
- normal
- variant
- PROTECTEDAREAS.ZPS
- TileMatrixSet
- PM
-
xyzservices.TileProviderGeoportailFrance.Protectedsites_Mnhn_Reserves_regionales
- url
- https://wxs.ign.fr/{apikey}/geoportail/wmts?REQUEST=GetTile&SERVICE=WMTS&VERSION=1.0.0&STYLE={style}&TILEMATRIXSET={TileMatrixSet}&FORMAT={format}&LAYER={variant}&TILEMATRIX={z}&TILEROW={y}&TILECOL={x}
- html_attribution
- Geoportail France
- attribution
- Geoportail France
- bounds
- [[-21.4756, -63.3725], [51.3121, 55.9259]]
- min_zoom
- 6
- max_zoom
- 16
- apikey
- environnement
- format
- image/png
- style
- normal
- variant
- PROTECTEDSITES.MNHN.RESERVES-REGIONALES
- TileMatrixSet
- PM
-
xyzservices.TileProviderGeoportailFrance.Ocsge_Constructions
- url
- https://wxs.ign.fr/{apikey}/geoportail/wmts?REQUEST=GetTile&SERVICE=WMTS&VERSION=1.0.0&STYLE={style}&TILEMATRIXSET={TileMatrixSet}&FORMAT={format}&LAYER={variant}&TILEMATRIX={z}&TILEROW={y}&TILECOL={x}
- html_attribution
- Geoportail France
- attribution
- Geoportail France
- bounds
- [[14.2395, -61.6644], [51.0991, 9.57054]]
- min_zoom
- 6
- max_zoom
- 16
- apikey
- ocsge
- format
- image/png
- style
- normal
- variant
- OCSGE.CONSTRUCTIONS
- TileMatrixSet
- PM
-
xyzservices.TileProviderGeoportailFrance.Ocsge_Constructions_2002
- url
- https://wxs.ign.fr/{apikey}/geoportail/wmts?REQUEST=GetTile&SERVICE=WMTS&VERSION=1.0.0&STYLE={style}&TILEMATRIXSET={TileMatrixSet}&FORMAT={format}&LAYER={variant}&TILEMATRIX={z}&TILEROW={y}&TILECOL={x}
- html_attribution
- Geoportail France
- attribution
- Geoportail France
- bounds
- [[41.366, -5.13902], [51.089, 9.55982]]
- min_zoom
- 6
- max_zoom
- 16
- apikey
- ocsge
- format
- image/png
- style
- nolegend
- variant
- OCSGE.CONSTRUCTIONS.2002
- TileMatrixSet
- PM
- status
- broken
-
xyzservices.TileProviderGeoportailFrance.Ocsge_Constructions_2010
- url
- https://wxs.ign.fr/{apikey}/geoportail/wmts?REQUEST=GetTile&SERVICE=WMTS&VERSION=1.0.0&STYLE={style}&TILEMATRIXSET={TileMatrixSet}&FORMAT={format}&LAYER={variant}&TILEMATRIX={z}&TILEROW={y}&TILECOL={x}
- html_attribution
- Geoportail France
- attribution
- Geoportail France
- bounds
- [[41.3252, -5.15047], [51.0991, 9.57054]]
- min_zoom
- 6
- max_zoom
- 16
- apikey
- ocsge
- format
- image/png
- style
- nolegend
- variant
- OCSGE.CONSTRUCTIONS.2010
- TileMatrixSet
- PM
-
xyzservices.TileProviderGeoportailFrance.Ocsge_Constructions_2011
- url
- https://wxs.ign.fr/{apikey}/geoportail/wmts?REQUEST=GetTile&SERVICE=WMTS&VERSION=1.0.0&STYLE={style}&TILEMATRIXSET={TileMatrixSet}&FORMAT={format}&LAYER={variant}&TILEMATRIX={z}&TILEROW={y}&TILECOL={x}
- html_attribution
- Geoportail France
- attribution
- Geoportail France
- bounds
- [[41.3252, -5.15047], [51.0991, 9.57054]]
- min_zoom
- 6
- max_zoom
- 16
- apikey
- ocsge
- format
- image/png
- style
- nolegend
- variant
- OCSGE.CONSTRUCTIONS.2011
- TileMatrixSet
- PM
-
xyzservices.TileProviderGeoportailFrance.Ocsge_Constructions_2014
- url
- https://wxs.ign.fr/{apikey}/geoportail/wmts?REQUEST=GetTile&SERVICE=WMTS&VERSION=1.0.0&STYLE={style}&TILEMATRIXSET={TileMatrixSet}&FORMAT={format}&LAYER={variant}&TILEMATRIX={z}&TILEROW={y}&TILECOL={x}
- html_attribution
- Geoportail France
- attribution
- Geoportail France
- bounds
- [[41.366, -5.13902], [51.089, 9.55982]]
- min_zoom
- 6
- max_zoom
- 16
- apikey
- ocsge
- format
- image/png
- style
- nolegend
- variant
- OCSGE.CONSTRUCTIONS.2014
- TileMatrixSet
- PM
- status
- broken
-
xyzservices.TileProviderGeoportailFrance.Ocsge_Constructions_2016
- url
- https://wxs.ign.fr/{apikey}/geoportail/wmts?REQUEST=GetTile&SERVICE=WMTS&VERSION=1.0.0&STYLE={style}&TILEMATRIXSET={TileMatrixSet}&FORMAT={format}&LAYER={variant}&TILEMATRIX={z}&TILEROW={y}&TILECOL={x}
- html_attribution
- Geoportail France
- attribution
- Geoportail France
- bounds
- [[41.3252, -5.15047], [51.0991, 9.57054]]
- min_zoom
- 6
- max_zoom
- 16
- apikey
- ocsge
- format
- image/png
- style
- nolegend
- variant
- OCSGE.CONSTRUCTIONS.2016
- TileMatrixSet
- PM
-
xyzservices.TileProviderGeoportailFrance.Ocsge_Constructions_2017
- url
- https://wxs.ign.fr/{apikey}/geoportail/wmts?REQUEST=GetTile&SERVICE=WMTS&VERSION=1.0.0&STYLE={style}&TILEMATRIXSET={TileMatrixSet}&FORMAT={format}&LAYER={variant}&TILEMATRIX={z}&TILEROW={y}&TILECOL={x}
- html_attribution
- Geoportail France
- attribution
- Geoportail France
- bounds
- [[14.2395, -61.6644], [51.0991, 9.57054]]
- min_zoom
- 6
- max_zoom
- 16
- apikey
- ocsge
- format
- image/png
- style
- nolegend
- variant
- OCSGE.CONSTRUCTIONS.2017
- TileMatrixSet
- PM
-
xyzservices.TileProviderGeoportailFrance.Ocsge_Constructions_2019
- url
- https://wxs.ign.fr/{apikey}/geoportail/wmts?REQUEST=GetTile&SERVICE=WMTS&VERSION=1.0.0&STYLE={style}&TILEMATRIXSET={TileMatrixSet}&FORMAT={format}&LAYER={variant}&TILEMATRIX={z}&TILEROW={y}&TILECOL={x}
- html_attribution
- Geoportail France
- attribution
- Geoportail France
- bounds
- [[43.3043, -0.291052], [44.0864, 1.2122]]
- min_zoom
- 6
- max_zoom
- 16
- apikey
- ocsge
- format
- image/png
- style
- nolegend
- variant
- OCSGE.CONSTRUCTIONS.2019
- TileMatrixSet
- PM
-
xyzservices.TileProviderGeoportailFrance.Ocsge_Couverture
- url
- https://wxs.ign.fr/{apikey}/geoportail/wmts?REQUEST=GetTile&SERVICE=WMTS&VERSION=1.0.0&STYLE={style}&TILEMATRIXSET={TileMatrixSet}&FORMAT={format}&LAYER={variant}&TILEMATRIX={z}&TILEROW={y}&TILECOL={x}
- html_attribution
- Geoportail France
- attribution
- Geoportail France
- bounds
- [[14.2395, -61.6644], [51.0991, 9.57054]]
- min_zoom
- 6
- max_zoom
- 16
- apikey
- ocsge
- format
- image/png
- style
- normal
- variant
- OCSGE.COUVERTURE
- TileMatrixSet
- PM
-
xyzservices.TileProviderGeoportailFrance.Ocsge_Couverture_2002
- url
- https://wxs.ign.fr/{apikey}/geoportail/wmts?REQUEST=GetTile&SERVICE=WMTS&VERSION=1.0.0&STYLE={style}&TILEMATRIXSET={TileMatrixSet}&FORMAT={format}&LAYER={variant}&TILEMATRIX={z}&TILEROW={y}&TILECOL={x}
- html_attribution
- Geoportail France
- attribution
- Geoportail France
- bounds
- [[41.366, -5.13902], [51.089, 9.55982]]
- min_zoom
- 6
- max_zoom
- 16
- apikey
- ocsge
- format
- image/png
- style
- normal
- variant
- OCSGE.COUVERTURE.2002
- TileMatrixSet
- PM
- status
- broken
-
xyzservices.TileProviderGeoportailFrance.Ocsge_Couverture_2010
- url
- https://wxs.ign.fr/{apikey}/geoportail/wmts?REQUEST=GetTile&SERVICE=WMTS&VERSION=1.0.0&STYLE={style}&TILEMATRIXSET={TileMatrixSet}&FORMAT={format}&LAYER={variant}&TILEMATRIX={z}&TILEROW={y}&TILECOL={x}
- html_attribution
- Geoportail France
- attribution
- Geoportail France
- bounds
- [[41.3252, -5.15047], [51.0991, 9.57054]]
- min_zoom
- 6
- max_zoom
- 16
- apikey
- ocsge
- format
- image/png
- style
- nolegend
- variant
- OCSGE.COUVERTURE.2010
- TileMatrixSet
- PM
-
xyzservices.TileProviderGeoportailFrance.Ocsge_Couverture_2011
- url
- https://wxs.ign.fr/{apikey}/geoportail/wmts?REQUEST=GetTile&SERVICE=WMTS&VERSION=1.0.0&STYLE={style}&TILEMATRIXSET={TileMatrixSet}&FORMAT={format}&LAYER={variant}&TILEMATRIX={z}&TILEROW={y}&TILECOL={x}
- html_attribution
- Geoportail France
- attribution
- Geoportail France
- bounds
- [[41.3252, -5.15047], [51.0991, 9.57054]]
- min_zoom
- 6
- max_zoom
- 16
- apikey
- ocsge
- format
- image/png
- style
- nolegend
- variant
- OCSGE.COUVERTURE.2011
- TileMatrixSet
- PM
-
xyzservices.TileProviderGeoportailFrance.Ocsge_Couverture_2014
- url
- https://wxs.ign.fr/{apikey}/geoportail/wmts?REQUEST=GetTile&SERVICE=WMTS&VERSION=1.0.0&STYLE={style}&TILEMATRIXSET={TileMatrixSet}&FORMAT={format}&LAYER={variant}&TILEMATRIX={z}&TILEROW={y}&TILECOL={x}
- html_attribution
- Geoportail France
- attribution
- Geoportail France
- bounds
- [[41.366, -5.13902], [51.089, 9.55982]]
- min_zoom
- 6
- max_zoom
- 16
- apikey
- ocsge
- format
- image/png
- style
- nolegend
- variant
- OCSGE.COUVERTURE.2014
- TileMatrixSet
- PM
- status
- broken
-
xyzservices.TileProviderGeoportailFrance.Ocsge_Couverture_2016
- url
- https://wxs.ign.fr/{apikey}/geoportail/wmts?REQUEST=GetTile&SERVICE=WMTS&VERSION=1.0.0&STYLE={style}&TILEMATRIXSET={TileMatrixSet}&FORMAT={format}&LAYER={variant}&TILEMATRIX={z}&TILEROW={y}&TILECOL={x}
- html_attribution
- Geoportail France
- attribution
- Geoportail France
- bounds
- [[41.3252, -5.15047], [51.0991, 9.57054]]
- min_zoom
- 6
- max_zoom
- 16
- apikey
- ocsge
- format
- image/png
- style
- nolegend
- variant
- OCSGE.COUVERTURE.2016
- TileMatrixSet
- PM
-
xyzservices.TileProviderGeoportailFrance.Ocsge_Couverture_2017
- url
- https://wxs.ign.fr/{apikey}/geoportail/wmts?REQUEST=GetTile&SERVICE=WMTS&VERSION=1.0.0&STYLE={style}&TILEMATRIXSET={TileMatrixSet}&FORMAT={format}&LAYER={variant}&TILEMATRIX={z}&TILEROW={y}&TILECOL={x}
- html_attribution
- Geoportail France
- attribution
- Geoportail France
- bounds
- [[14.2395, -61.6644], [51.0991, 9.57054]]
- min_zoom
- 6
- max_zoom
- 16
- apikey
- ocsge
- format
- image/png
- style
- nolegend
- variant
- OCSGE.COUVERTURE.2017
- TileMatrixSet
- PM
-
xyzservices.TileProviderGeoportailFrance.Ocsge_Couverture_2019
- url
- https://wxs.ign.fr/{apikey}/geoportail/wmts?REQUEST=GetTile&SERVICE=WMTS&VERSION=1.0.0&STYLE={style}&TILEMATRIXSET={TileMatrixSet}&FORMAT={format}&LAYER={variant}&TILEMATRIX={z}&TILEROW={y}&TILECOL={x}
- html_attribution
- Geoportail France
- attribution
- Geoportail France
- bounds
- [[43.3043, -0.291052], [44.0864, 1.2122]]
- min_zoom
- 6
- max_zoom
- 16
- apikey
- ocsge
- format
- image/png
- style
- nolegend
- variant
- OCSGE.COUVERTURE.2019
- TileMatrixSet
- PM
-
xyzservices.TileProviderGeoportailFrance.Ocsge_Usage
- url
- https://wxs.ign.fr/{apikey}/geoportail/wmts?REQUEST=GetTile&SERVICE=WMTS&VERSION=1.0.0&STYLE={style}&TILEMATRIXSET={TileMatrixSet}&FORMAT={format}&LAYER={variant}&TILEMATRIX={z}&TILEROW={y}&TILECOL={x}
- html_attribution
- Geoportail France
- attribution
- Geoportail France
- bounds
- [[14.2395, -61.6644], [51.0991, 9.57054]]
- min_zoom
- 6
- max_zoom
- 16
- apikey
- ocsge
- format
- image/png
- style
- normal
- variant
- OCSGE.USAGE
- TileMatrixSet
- PM
-
xyzservices.TileProviderGeoportailFrance.Ocsge_Usage_2002
- url
- https://wxs.ign.fr/{apikey}/geoportail/wmts?REQUEST=GetTile&SERVICE=WMTS&VERSION=1.0.0&STYLE={style}&TILEMATRIXSET={TileMatrixSet}&FORMAT={format}&LAYER={variant}&TILEMATRIX={z}&TILEROW={y}&TILECOL={x}
- html_attribution
- Geoportail France
- attribution
- Geoportail France
- bounds
- [[41.366, -5.13902], [51.089, 9.55982]]
- min_zoom
- 6
- max_zoom
- 16
- apikey
- ocsge
- format
- image/png
- style
- normal
- variant
- OCSGE.USAGE.2002
- TileMatrixSet
- PM
- status
- broken
-
xyzservices.TileProviderGeoportailFrance.Ocsge_Usage_2010
- url
- https://wxs.ign.fr/{apikey}/geoportail/wmts?REQUEST=GetTile&SERVICE=WMTS&VERSION=1.0.0&STYLE={style}&TILEMATRIXSET={TileMatrixSet}&FORMAT={format}&LAYER={variant}&TILEMATRIX={z}&TILEROW={y}&TILECOL={x}
- html_attribution
- Geoportail France
- attribution
- Geoportail France
- bounds
- [[41.3252, -5.15047], [51.0991, 9.57054]]
- min_zoom
- 6
- max_zoom
- 16
- apikey
- ocsge
- format
- image/png
- style
- nolegend
- variant
- OCSGE.USAGE.2010
- TileMatrixSet
- PM
-
xyzservices.TileProviderGeoportailFrance.Ocsge_Usage_2011
- url
- https://wxs.ign.fr/{apikey}/geoportail/wmts?REQUEST=GetTile&SERVICE=WMTS&VERSION=1.0.0&STYLE={style}&TILEMATRIXSET={TileMatrixSet}&FORMAT={format}&LAYER={variant}&TILEMATRIX={z}&TILEROW={y}&TILECOL={x}
- html_attribution
- Geoportail France
- attribution
- Geoportail France
- bounds
- [[41.3252, -5.15047], [51.0991, 9.57054]]
- min_zoom
- 6
- max_zoom
- 16
- apikey
- ocsge
- format
- image/png
- style
- nolegend
- variant
- OCSGE.USAGE.2011
- TileMatrixSet
- PM
-
xyzservices.TileProviderGeoportailFrance.Ocsge_Usage_2014
- url
- https://wxs.ign.fr/{apikey}/geoportail/wmts?REQUEST=GetTile&SERVICE=WMTS&VERSION=1.0.0&STYLE={style}&TILEMATRIXSET={TileMatrixSet}&FORMAT={format}&LAYER={variant}&TILEMATRIX={z}&TILEROW={y}&TILECOL={x}
- html_attribution
- Geoportail France
- attribution
- Geoportail France
- bounds
- [[41.366, -5.13902], [51.089, 9.55982]]
- min_zoom
- 6
- max_zoom
- 16
- apikey
- ocsge
- format
- image/png
- style
- normal
- variant
- OCSGE.USAGE.2014
- TileMatrixSet
- PM
- status
- broken
-
xyzservices.TileProviderGeoportailFrance.Ocsge_Usage_2016
- url
- https://wxs.ign.fr/{apikey}/geoportail/wmts?REQUEST=GetTile&SERVICE=WMTS&VERSION=1.0.0&STYLE={style}&TILEMATRIXSET={TileMatrixSet}&FORMAT={format}&LAYER={variant}&TILEMATRIX={z}&TILEROW={y}&TILECOL={x}
- html_attribution
- Geoportail France
- attribution
- Geoportail France
- bounds
- [[41.3252, -5.15047], [51.0991, 9.57054]]
- min_zoom
- 6
- max_zoom
- 16
- apikey
- ocsge
- format
- image/png
- style
- nolegend
- variant
- OCSGE.USAGE.2016
- TileMatrixSet
- PM
-
xyzservices.TileProviderGeoportailFrance.Ocsge_Usage_2017
- url
- https://wxs.ign.fr/{apikey}/geoportail/wmts?REQUEST=GetTile&SERVICE=WMTS&VERSION=1.0.0&STYLE={style}&TILEMATRIXSET={TileMatrixSet}&FORMAT={format}&LAYER={variant}&TILEMATRIX={z}&TILEROW={y}&TILECOL={x}
- html_attribution
- Geoportail France
- attribution
- Geoportail France
- bounds
- [[14.2395, -61.6644], [51.0991, 9.57054]]
- min_zoom
- 6
- max_zoom
- 16
- apikey
- ocsge
- format
- image/png
- style
- nolegend
- variant
- OCSGE.USAGE.2017
- TileMatrixSet
- PM
-
xyzservices.TileProviderGeoportailFrance.Ocsge_Usage_2019
- url
- https://wxs.ign.fr/{apikey}/geoportail/wmts?REQUEST=GetTile&SERVICE=WMTS&VERSION=1.0.0&STYLE={style}&TILEMATRIXSET={TileMatrixSet}&FORMAT={format}&LAYER={variant}&TILEMATRIX={z}&TILEROW={y}&TILECOL={x}
- html_attribution
- Geoportail France
- attribution
- Geoportail France
- bounds
- [[43.3043, -0.291052], [44.0864, 1.2122]]
- min_zoom
- 6
- max_zoom
- 16
- apikey
- ocsge
- format
- image/png
- style
- nolegend
- variant
- OCSGE.USAGE.2019
- TileMatrixSet
- PM
-
xyzservices.TileProviderGeoportailFrance.Ocsge_Visu_2016
- url
- https://wxs.ign.fr/{apikey}/geoportail/wmts?REQUEST=GetTile&SERVICE=WMTS&VERSION=1.0.0&STYLE={style}&TILEMATRIXSET={TileMatrixSet}&FORMAT={format}&LAYER={variant}&TILEMATRIX={z}&TILEROW={y}&TILECOL={x}
- html_attribution
- Geoportail France
- attribution
- Geoportail France
- bounds
- [[43.2815, -0.318517], [44.0543, 1.22575]]
- min_zoom
- 6
- max_zoom
- 18
- apikey
- ocsge
- format
- image/png
- style
- nolegend
- variant
- OCSGE.VISU.2016
- TileMatrixSet
- PM
-
xyzservices.TileProviderGeoportailFrance.Ocsge_Visu_2019
- url
- https://wxs.ign.fr/{apikey}/geoportail/wmts?REQUEST=GetTile&SERVICE=WMTS&VERSION=1.0.0&STYLE={style}&TILEMATRIXSET={TileMatrixSet}&FORMAT={format}&LAYER={variant}&TILEMATRIX={z}&TILEROW={y}&TILECOL={x}
- html_attribution
- Geoportail France
- attribution
- Geoportail France
- bounds
- [[43.2815, -0.321664], [44.1082, 1.22575]]
- min_zoom
- 6
- max_zoom
- 18
- apikey
- ocsge
- format
- image/png
- style
- nolegend
- variant
- OCSGE.VISU.2019
- TileMatrixSet
- PM
-
xyzservices.TileProviderGeoportailFrance.Hr_Orthoimagery_Orthophotos
- url
- https://wxs.ign.fr/{apikey}/geoportail/wmts?REQUEST=GetTile&SERVICE=WMTS&VERSION=1.0.0&STYLE={style}&TILEMATRIXSET={TileMatrixSet}&FORMAT={format}&LAYER={variant}&TILEMATRIX={z}&TILEROW={y}&TILECOL={x}
- html_attribution
- Geoportail France
- attribution
- Geoportail France
- bounds
- [[-21.4013, -63.1607], [51.1124, 55.8464]]
- min_zoom
- 6
- max_zoom
- 19
- apikey
- ortho
- format
- image/jpeg
- style
- normal
- variant
- HR.ORTHOIMAGERY.ORTHOPHOTOS
- TileMatrixSet
- PM
-
xyzservices.TileProviderGeoportailFrance.Orthoimagery_Orthophos_Restrictedareas
- url
- https://wxs.ign.fr/{apikey}/geoportail/wmts?REQUEST=GetTile&SERVICE=WMTS&VERSION=1.0.0&STYLE={style}&TILEMATRIXSET={TileMatrixSet}&FORMAT={format}&LAYER={variant}&TILEMATRIX={z}&TILEROW={y}&TILECOL={x}
- html_attribution
- Geoportail France
- attribution
- Geoportail France
- bounds
- [[-22.9723, -178.309], [51.3121, 168.298]]
- min_zoom
- 6
- max_zoom
- 16
- apikey
- ortho
- format
- image/png
- style
- normal
- variant
- ORTHOIMAGERY.ORTHOPHOS.RESTRICTEDAREAS
- TileMatrixSet
- PM
-
xyzservices.TileProviderGeoportailFrance.Orthoimagery_Orthophotos_Bdortho
- url
- https://wxs.ign.fr/{apikey}/geoportail/wmts?REQUEST=GetTile&SERVICE=WMTS&VERSION=1.0.0&STYLE={style}&TILEMATRIXSET={TileMatrixSet}&FORMAT={format}&LAYER={variant}&TILEMATRIX={z}&TILEROW={y}&TILECOL={x}
- html_attribution
- Geoportail France
- attribution
- Geoportail France
- bounds
- [[-22.7643, -178.187], [51.1124, 168.19]]
- min_zoom
- 6
- max_zoom
- 18
- apikey
- ortho
- format
- image/jpeg
- style
- normal
- variant
- ORTHOIMAGERY.ORTHOPHOTOS.BDORTHO
- TileMatrixSet
- PM
-
xyzservices.TileProviderGeoportailFrance.Orthoimagery_Orthophotos_Coast2000
- url
- https://wxs.ign.fr/{apikey}/geoportail/wmts?REQUEST=GetTile&SERVICE=WMTS&VERSION=1.0.0&STYLE={style}&TILEMATRIXSET={TileMatrixSet}&FORMAT={format}&LAYER={variant}&TILEMATRIX={z}&TILEROW={y}&TILECOL={x}
- html_attribution
- Geoportail France
- attribution
- Geoportail France
- bounds
- [[43.301, -5.21565], [51.1233, 2.60783]]
- min_zoom
- 6
- max_zoom
- 18
- apikey
- ortho
- format
- image/png
- style
- normal
- variant
- ORTHOIMAGERY.ORTHOPHOTOS.COAST2000
- TileMatrixSet
- PM
- status
- broken
-
xyzservices.TileProviderGeoportailFrance.Orthoimagery_Orthophotos_Ilesdunord
- url
- https://wxs.ign.fr/{apikey}/geoportail/wmts?REQUEST=GetTile&SERVICE=WMTS&VERSION=1.0.0&STYLE={style}&TILEMATRIXSET={TileMatrixSet}&FORMAT={format}&LAYER={variant}&TILEMATRIX={z}&TILEROW={y}&TILECOL={x}
- html_attribution
- Geoportail France
- attribution
- Geoportail France
- bounds
- [[17.8626, -63.1986], [18.1701, -62.7828]]
- min_zoom
- 0
- max_zoom
- 19
- apikey
- ortho
- format
- image/png
- style
- normal
- variant
- ORTHOIMAGERY.ORTHOPHOTOS.ILESDUNORD
- TileMatrixSet
- PM
-
xyzservices.TileProviderGeoportailFrance.Orthoimagery_Orthophotos_Irc
- url
- https://wxs.ign.fr/{apikey}/geoportail/wmts?REQUEST=GetTile&SERVICE=WMTS&VERSION=1.0.0&STYLE={style}&TILEMATRIXSET={TileMatrixSet}&FORMAT={format}&LAYER={variant}&TILEMATRIX={z}&TILEROW={y}&TILECOL={x}
- html_attribution
- Geoportail France
- attribution
- Geoportail France
- bounds
- [[-21.4013, -62.9717], [51.1124, 55.8464]]
- min_zoom
- 0
- max_zoom
- 19
- apikey
- ortho
- format
- image/jpeg
- style
- normal
- variant
- ORTHOIMAGERY.ORTHOPHOTOS.IRC
- TileMatrixSet
- PM
-
xyzservices.TileProviderGeoportailFrance.Orthoimagery_Orthophotos_Irc_express_2022
- url
- https://wxs.ign.fr/{apikey}/geoportail/wmts?REQUEST=GetTile&SERVICE=WMTS&VERSION=1.0.0&STYLE={style}&TILEMATRIXSET={TileMatrixSet}&FORMAT={format}&LAYER={variant}&TILEMATRIX={z}&TILEROW={y}&TILECOL={x}
- html_attribution
- Geoportail France
- attribution
- Geoportail France
- bounds
- [[-75.0, -179.5], [75.0, 179.5]]
- min_zoom
- 0
- max_zoom
- 19
- apikey
- orthohisto
- format
- image/jpeg
- style
- normal
- variant
- ORTHOIMAGERY.ORTHOPHOTOS.IRC-EXPRESS.2022
- TileMatrixSet
- PM
-
xyzservices.TileProviderGeoportailFrance.Orthoimagery_Orthophotos_Irc_express_2023
- url
- https://wxs.ign.fr/{apikey}/geoportail/wmts?REQUEST=GetTile&SERVICE=WMTS&VERSION=1.0.0&STYLE={style}&TILEMATRIXSET={TileMatrixSet}&FORMAT={format}&LAYER={variant}&TILEMATRIX={z}&TILEROW={y}&TILECOL={x}
- html_attribution
- Geoportail France
- attribution
- Geoportail France
- bounds
- [[-75.0, -179.5], [75.0, 179.5]]
- min_zoom
- 0
- max_zoom
- 19
- apikey
- ortho
- format
- image/jpeg
- style
- normal
- variant
- ORTHOIMAGERY.ORTHOPHOTOS.IRC-EXPRESS.2023
- TileMatrixSet
- PM
-
xyzservices.TileProviderGeoportailFrance.Orthoimagery_Orthophotos_Ortho_asp_pac2022
- url
- https://wxs.ign.fr/{apikey}/geoportail/wmts?REQUEST=GetTile&SERVICE=WMTS&VERSION=1.0.0&STYLE={style}&TILEMATRIXSET={TileMatrixSet}&FORMAT={format}&LAYER={variant}&TILEMATRIX={z}&TILEROW={y}&TILECOL={x}
- html_attribution
- Geoportail France
- attribution
- Geoportail France
- bounds
- [[-75.0, -179.5], [75.0, 179.5]]
- min_zoom
- 0
- max_zoom
- 18
- apikey
- orthohisto
- format
- image/jpeg
- style
- normal
- variant
- ORTHOIMAGERY.ORTHOPHOTOS.ORTHO-ASP_PAC2022
- TileMatrixSet
- PM
-
xyzservices.TileProviderGeoportailFrance.Orthoimagery_Orthophotos_Ortho_asp_pac2023
- url
- https://wxs.ign.fr/{apikey}/geoportail/wmts?REQUEST=GetTile&SERVICE=WMTS&VERSION=1.0.0&STYLE={style}&TILEMATRIXSET={TileMatrixSet}&FORMAT={format}&LAYER={variant}&TILEMATRIX={z}&TILEROW={y}&TILECOL={x}
- html_attribution
- Geoportail France
- attribution
- Geoportail France
- bounds
- [[-75.0, -179.5], [75.0, 179.5]]
- min_zoom
- 0
- max_zoom
- 18
- apikey
- ortho
- format
- image/jpeg
- style
- normal
- variant
- ORTHOIMAGERY.ORTHOPHOTOS.ORTHO-ASP_PAC2023
- TileMatrixSet
- PM
-
xyzservices.TileProviderGeoportailFrance.Orthoimagery_Orthophotos_Ortho_express_2022
- url
- https://wxs.ign.fr/{apikey}/geoportail/wmts?REQUEST=GetTile&SERVICE=WMTS&VERSION=1.0.0&STYLE={style}&TILEMATRIXSET={TileMatrixSet}&FORMAT={format}&LAYER={variant}&TILEMATRIX={z}&TILEROW={y}&TILECOL={x}
- html_attribution
- Geoportail France
- attribution
- Geoportail France
- bounds
- [[-75.0, -179.5], [75.0, 179.5]]
- min_zoom
- 0
- max_zoom
- 19
- apikey
- orthohisto
- format
- image/jpeg
- style
- normal
- variant
- ORTHOIMAGERY.ORTHOPHOTOS.ORTHO-EXPRESS.2022
- TileMatrixSet
- PM
-
xyzservices.TileProviderGeoportailFrance.Orthoimagery_Orthophotos_Ortho_express_2023
- url
- https://wxs.ign.fr/{apikey}/geoportail/wmts?REQUEST=GetTile&SERVICE=WMTS&VERSION=1.0.0&STYLE={style}&TILEMATRIXSET={TileMatrixSet}&FORMAT={format}&LAYER={variant}&TILEMATRIX={z}&TILEROW={y}&TILECOL={x}
- html_attribution
- Geoportail France
- attribution
- Geoportail France
- bounds
- [[-75.0, -179.5], [75.0, 179.5]]
- min_zoom
- 0
- max_zoom
- 19
- apikey
- ortho
- format
- image/jpeg
- style
- normal
- variant
- ORTHOIMAGERY.ORTHOPHOTOS.ORTHO-EXPRESS.2023
- TileMatrixSet
- PM
-
xyzservices.TileProviderGeoportailFrance.Pcrs_Lamb93
- url
- https://wxs.ign.fr/{apikey}/geoportail/wmts?REQUEST=GetTile&SERVICE=WMTS&VERSION=1.0.0&STYLE={style}&TILEMATRIXSET={TileMatrixSet}&FORMAT={format}&LAYER={variant}&TILEMATRIX={z}&TILEROW={y}&TILECOL={x}
- html_attribution
- Geoportail France
- attribution
- Geoportail France
- bounds
- [[42.6976, -3.80779], [48.8107, 6.92319]]
- min_zoom
- 6
- max_zoom
- 21
- apikey
- ortho
- format
- image/jpeg
- style
- normal
- variant
- PCRS.LAMB93
- TileMatrixSet
- LAMB93_5cm_EPSG
- status
- broken
-
xyzservices.TileProviderGeoportailFrance.Thr_Orthoimagery_Orthophotos
- url
- https://wxs.ign.fr/{apikey}/geoportail/wmts?REQUEST=GetTile&SERVICE=WMTS&VERSION=1.0.0&STYLE={style}&TILEMATRIXSET={TileMatrixSet}&FORMAT={format}&LAYER={variant}&TILEMATRIX={z}&TILEROW={y}&TILECOL={x}
- html_attribution
- Geoportail France
- attribution
- Geoportail France
- bounds
- [[40.4378, -6.92466], [51.9098, 11.4965]]
- min_zoom
- 6
- max_zoom
- 21
- apikey
- ortho
- format
- image/jpeg
- style
- normal
- variant
- THR.ORTHOIMAGERY.ORTHOPHOTOS
- TileMatrixSet
- PM
-
xyzservices.TileProviderGeoportailFrance.Orthoimagery_Orthophotos_1950_1965
- url
- https://wxs.ign.fr/{apikey}/geoportail/wmts?REQUEST=GetTile&SERVICE=WMTS&VERSION=1.0.0&STYLE={style}&TILEMATRIXSET={TileMatrixSet}&FORMAT={format}&LAYER={variant}&TILEMATRIX={z}&TILEROW={y}&TILECOL={x}
- html_attribution
- Geoportail France
- attribution
- Geoportail France
- bounds
- [[-21.4013, -67.7214], [51.0945, 55.8464]]
- min_zoom
- 3
- max_zoom
- 18
- apikey
- orthohisto
- format
- image/png
- style
- normal
- variant
- ORTHOIMAGERY.ORTHOPHOTOS.1950-1965
- TileMatrixSet
- PM
-
xyzservices.TileProviderGeoportailFrance.Orthoimagery_Orthophotos_1980_1995
- url
- https://wxs.ign.fr/{apikey}/geoportail/wmts?REQUEST=GetTile&SERVICE=WMTS&VERSION=1.0.0&STYLE={style}&TILEMATRIXSET={TileMatrixSet}&FORMAT={format}&LAYER={variant}&TILEMATRIX={z}&TILEROW={y}&TILECOL={x}
- html_attribution
- Geoportail France
- attribution
- Geoportail France
- bounds
- [[41.3125, -2.37153], [49.7785, 9.67536]]
- min_zoom
- 3
- max_zoom
- 18
- apikey
- orthohisto
- format
- image/png
- style
- BDORTHOHISTORIQUE
- variant
- ORTHOIMAGERY.ORTHOPHOTOS.1980-1995
- TileMatrixSet
- PM
- status
- broken
-
xyzservices.TileProviderGeoportailFrance.Orthoimagery_Orthophotos_Irc_express_2021
- url
- https://wxs.ign.fr/{apikey}/geoportail/wmts?REQUEST=GetTile&SERVICE=WMTS&VERSION=1.0.0&STYLE={style}&TILEMATRIXSET={TileMatrixSet}&FORMAT={format}&LAYER={variant}&TILEMATRIX={z}&TILEROW={y}&TILECOL={x}
- html_attribution
- Geoportail France
- attribution
- Geoportail France
- bounds
- [[-75.0, -179.5], [75.0, 179.5]]
- min_zoom
- 0
- max_zoom
- 19
- apikey
- orthohisto
- format
- image/jpeg
- style
- normal
- variant
- ORTHOIMAGERY.ORTHOPHOTOS.IRC-EXPRESS.2021
- TileMatrixSet
- PM
-
xyzservices.TileProviderGeoportailFrance.Orthoimagery_Orthophotos_Irc_2013
- url
- https://wxs.ign.fr/{apikey}/geoportail/wmts?REQUEST=GetTile&SERVICE=WMTS&VERSION=1.0.0&STYLE={style}&TILEMATRIXSET={TileMatrixSet}&FORMAT={format}&LAYER={variant}&TILEMATRIX={z}&TILEROW={y}&TILECOL={x}
- html_attribution
- Geoportail France
- attribution
- Geoportail France
- bounds
- [[42.5538, -3.74871], [50.3767, 7.17132]]
- min_zoom
- 0
- max_zoom
- 19
- apikey
- orthohisto
- format
- image/jpeg
- style
- normal
- variant
- ORTHOIMAGERY.ORTHOPHOTOS.IRC.2013
- TileMatrixSet
- PM
-
xyzservices.TileProviderGeoportailFrance.Orthoimagery_Orthophotos_Irc_2014
- url
- https://wxs.ign.fr/{apikey}/geoportail/wmts?REQUEST=GetTile&SERVICE=WMTS&VERSION=1.0.0&STYLE={style}&TILEMATRIXSET={TileMatrixSet}&FORMAT={format}&LAYER={variant}&TILEMATRIX={z}&TILEROW={y}&TILECOL={x}
- html_attribution
- Geoportail France
- attribution
- Geoportail France
- bounds
- [[43.1508, -2.37153], [49.6341, 7.22637]]
- min_zoom
- 0
- max_zoom
- 19
- apikey
- orthohisto
- format
- image/jpeg
- style
- normal
- variant
- ORTHOIMAGERY.ORTHOPHOTOS.IRC.2014
- TileMatrixSet
- PM
-
xyzservices.TileProviderGeoportailFrance.Orthoimagery_Orthophotos_Irc_2015
- url
- https://wxs.ign.fr/{apikey}/geoportail/wmts?REQUEST=GetTile&SERVICE=WMTS&VERSION=1.0.0&STYLE={style}&TILEMATRIXSET={TileMatrixSet}&FORMAT={format}&LAYER={variant}&TILEMATRIX={z}&TILEROW={y}&TILECOL={x}
- html_attribution
- Geoportail France
- attribution
- Geoportail France
- bounds
- [[42.3163, -5.20863], [51.0945, 8.25674]]
- min_zoom
- 0
- max_zoom
- 19
- apikey
- orthohisto
- format
- image/jpeg
- style
- normal
- variant
- ORTHOIMAGERY.ORTHOPHOTOS.IRC.2015
- TileMatrixSet
- PM
-
xyzservices.TileProviderGeoportailFrance.Orthoimagery_Orthophotos_Irc_2016
- url
- https://wxs.ign.fr/{apikey}/geoportail/wmts?REQUEST=GetTile&SERVICE=WMTS&VERSION=1.0.0&STYLE={style}&TILEMATRIXSET={TileMatrixSet}&FORMAT={format}&LAYER={variant}&TILEMATRIX={z}&TILEROW={y}&TILECOL={x}
- html_attribution
- Geoportail France
- attribution
- Geoportail France
- bounds
- [[41.3215, -3.74871], [50.1839, 9.66314]]
- min_zoom
- 0
- max_zoom
- 19
- apikey
- orthohisto
- format
- image/jpeg
- style
- normal
- variant
- ORTHOIMAGERY.ORTHOPHOTOS.IRC.2016
- TileMatrixSet
- PM
-
xyzservices.TileProviderGeoportailFrance.Orthoimagery_Orthophotos_Irc_2017
- url
- https://wxs.ign.fr/{apikey}/geoportail/wmts?REQUEST=GetTile&SERVICE=WMTS&VERSION=1.0.0&STYLE={style}&TILEMATRIXSET={TileMatrixSet}&FORMAT={format}&LAYER={variant}&TILEMATRIX={z}&TILEROW={y}&TILECOL={x}
- html_attribution
- Geoportail France
- attribution
- Geoportail France
- bounds
- [[42.9454, -0.185295], [46.4137, 7.74363]]
- min_zoom
- 0
- max_zoom
- 19
- apikey
- orthohisto
- format
- image/jpeg
- style
- normal
- variant
- ORTHOIMAGERY.ORTHOPHOTOS.IRC.2017
- TileMatrixSet
- PM
-
xyzservices.TileProviderGeoportailFrance.Orthoimagery_Orthophotos_Irc_2018
- url
- https://wxs.ign.fr/{apikey}/geoportail/wmts?REQUEST=GetTile&SERVICE=WMTS&VERSION=1.0.0&STYLE={style}&TILEMATRIXSET={TileMatrixSet}&FORMAT={format}&LAYER={variant}&TILEMATRIX={z}&TILEROW={y}&TILECOL={x}
- html_attribution
- Geoportail France
- attribution
- Geoportail France
- bounds
- [[42.3163, -5.19371], [51.1124, 8.25765]]
- min_zoom
- 0
- max_zoom
- 19
- apikey
- orthohisto
- format
- image/jpeg
- style
- normal
- variant
- ORTHOIMAGERY.ORTHOPHOTOS.IRC.2018
- TileMatrixSet
- PM
-
xyzservices.TileProviderGeoportailFrance.Orthoimagery_Orthophotos_Irc_2019
- url
- https://wxs.ign.fr/{apikey}/geoportail/wmts?REQUEST=GetTile&SERVICE=WMTS&VERSION=1.0.0&STYLE={style}&TILEMATRIXSET={TileMatrixSet}&FORMAT={format}&LAYER={variant}&TILEMATRIX={z}&TILEROW={y}&TILECOL={x}
- html_attribution
- Geoportail France
- attribution
- Geoportail France
- bounds
- [[41.3125, -3.74871], [50.1928, 9.66314]]
- min_zoom
- 0
- max_zoom
- 19
- apikey
- orthohisto
- format
- image/jpeg
- style
- normal
- variant
- ORTHOIMAGERY.ORTHOPHOTOS.IRC.2019
- TileMatrixSet
- PM
-
xyzservices.TileProviderGeoportailFrance.Orthoimagery_Orthophotos_Irc_2020
- url
- https://wxs.ign.fr/{apikey}/geoportail/wmts?REQUEST=GetTile&SERVICE=WMTS&VERSION=1.0.0&STYLE={style}&TILEMATRIXSET={TileMatrixSet}&FORMAT={format}&LAYER={variant}&TILEMATRIX={z}&TILEROW={y}&TILECOL={x}
- html_attribution
- Geoportail France
- attribution
- Geoportail France
- bounds
- [[42.9454, -2.68142], [49.4512, 7.74363]]
- min_zoom
- 0
- max_zoom
- 19
- apikey
- orthohisto
- format
- image/jpeg
- style
- normal
- variant
- ORTHOIMAGERY.ORTHOPHOTOS.IRC.2020
- TileMatrixSet
- PM
-
xyzservices.TileProviderGeoportailFrance.Orthoimagery_Orthophotos_Ortho_asp_pac2020
- url
- https://wxs.ign.fr/{apikey}/geoportail/wmts?REQUEST=GetTile&SERVICE=WMTS&VERSION=1.0.0&STYLE={style}&TILEMATRIXSET={TileMatrixSet}&FORMAT={format}&LAYER={variant}&TILEMATRIX={z}&TILEROW={y}&TILECOL={x}
- html_attribution
- Geoportail France
- attribution
- Geoportail France
- bounds
- [[-75.0, -179.5], [75.0, 179.5]]
- min_zoom
- 0
- max_zoom
- 18
- apikey
- orthohisto
- format
- image/jpeg
- style
- normal
- variant
- ORTHOIMAGERY.ORTHOPHOTOS.ORTHO-ASP_PAC2020
- TileMatrixSet
- PM
-
xyzservices.TileProviderGeoportailFrance.Orthoimagery_Orthophotos_Ortho_asp_pac2021
- url
- https://wxs.ign.fr/{apikey}/geoportail/wmts?REQUEST=GetTile&SERVICE=WMTS&VERSION=1.0.0&STYLE={style}&TILEMATRIXSET={TileMatrixSet}&FORMAT={format}&LAYER={variant}&TILEMATRIX={z}&TILEROW={y}&TILECOL={x}
- html_attribution
- Geoportail France
- attribution
- Geoportail France
- bounds
- [[-75.0, -179.5], [75.0, 179.5]]
- min_zoom
- 0
- max_zoom
- 18
- apikey
- orthohisto
- format
- image/jpeg
- style
- normal
- variant
- ORTHOIMAGERY.ORTHOPHOTOS.ORTHO-ASP_PAC2021
- TileMatrixSet
- PM
-
xyzservices.TileProviderGeoportailFrance.Orthoimagery_Orthophotos_Ortho_express_2021
- url
- https://wxs.ign.fr/{apikey}/geoportail/wmts?REQUEST=GetTile&SERVICE=WMTS&VERSION=1.0.0&STYLE={style}&TILEMATRIXSET={TileMatrixSet}&FORMAT={format}&LAYER={variant}&TILEMATRIX={z}&TILEROW={y}&TILECOL={x}
- html_attribution
- Geoportail France
- attribution
- Geoportail France
- bounds
- [[-75.0, -179.5], [75.0, 179.5]]
- min_zoom
- 0
- max_zoom
- 20
- apikey
- orthohisto
- format
- image/jpeg
- style
- normal
- variant
- ORTHOIMAGERY.ORTHOPHOTOS.ORTHO-EXPRESS.2021
- TileMatrixSet
- PM
-
xyzservices.TileProviderGeoportailFrance.Orthoimagery_Orthophotos_Socle_asp_2018
- url
- https://wxs.ign.fr/{apikey}/geoportail/wmts?REQUEST=GetTile&SERVICE=WMTS&VERSION=1.0.0&STYLE={style}&TILEMATRIXSET={TileMatrixSet}&FORMAT={format}&LAYER={variant}&TILEMATRIX={z}&TILEROW={y}&TILECOL={x}
- html_attribution
- Geoportail France
- attribution
- Geoportail France
- bounds
- [[-75.0, -179.5], [75.0, 179.5]]
- min_zoom
- 0
- max_zoom
- 19
- apikey
- orthohisto
- format
- image/jpeg
- style
- normal
- variant
- ORTHOIMAGERY.ORTHOPHOTOS.SOCLE-ASP.2018
- TileMatrixSet
- PM
-
xyzservices.TileProviderGeoportailFrance.Orthoimagery_Orthophotos_Urgence_Alex
- url
- https://wxs.ign.fr/{apikey}/geoportail/wmts?REQUEST=GetTile&SERVICE=WMTS&VERSION=1.0.0&STYLE={style}&TILEMATRIXSET={TileMatrixSet}&FORMAT={format}&LAYER={variant}&TILEMATRIX={z}&TILEROW={y}&TILECOL={x}
- html_attribution
- Geoportail France
- attribution
- Geoportail France
- bounds
- [[43.8095, 7.07917], [44.1903, 7.64199]]
- min_zoom
- 6
- max_zoom
- 20
- apikey
- orthohisto
- format
- image/jpeg
- style
- normal
- variant
- ORTHOIMAGERY.ORTHOPHOTOS.URGENCE.ALEX
- TileMatrixSet
- PM
-
xyzservices.TileProviderGeoportailFrance.Orthoimagery_Orthophotos2000
- url
- https://wxs.ign.fr/{apikey}/geoportail/wmts?REQUEST=GetTile&SERVICE=WMTS&VERSION=1.0.0&STYLE={style}&TILEMATRIXSET={TileMatrixSet}&FORMAT={format}&LAYER={variant}&TILEMATRIX={z}&TILEROW={y}&TILECOL={x}
- html_attribution
- Geoportail France
- attribution
- Geoportail France
- bounds
- [[-75.0, -179.5], [75.0, 179.5]]
- min_zoom
- 0
- max_zoom
- 18
- apikey
- orthohisto
- format
- image/jpeg
- style
- normal
- variant
- ORTHOIMAGERY.ORTHOPHOTOS2000
- TileMatrixSet
- PM
-
xyzservices.TileProviderGeoportailFrance.Orthoimagery_Orthophotos2000_2005
- url
- https://wxs.ign.fr/{apikey}/geoportail/wmts?REQUEST=GetTile&SERVICE=WMTS&VERSION=1.0.0&STYLE={style}&TILEMATRIXSET={TileMatrixSet}&FORMAT={format}&LAYER={variant}&TILEMATRIX={z}&TILEROW={y}&TILECOL={x}
- html_attribution
- Geoportail France
- attribution
- Geoportail France
- bounds
- [[-21.4013, -178.187], [64.0698, 55.8561]]
- min_zoom
- 6
- max_zoom
- 18
- apikey
- orthohisto
- format
- image/jpeg
- style
- normal
- variant
- ORTHOIMAGERY.ORTHOPHOTOS2000-2005
- TileMatrixSet
- PM
-
xyzservices.TileProviderGeoportailFrance.Orthoimagery_Orthophotos2001
- url
- https://wxs.ign.fr/{apikey}/geoportail/wmts?REQUEST=GetTile&SERVICE=WMTS&VERSION=1.0.0&STYLE={style}&TILEMATRIXSET={TileMatrixSet}&FORMAT={format}&LAYER={variant}&TILEMATRIX={z}&TILEROW={y}&TILECOL={x}
- html_attribution
- Geoportail France
- attribution
- Geoportail France
- bounds
- [[4.47153, -61.2472], [50.3765, 7.23234]]
- min_zoom
- 6
- max_zoom
- 18
- apikey
- orthohisto
- format
- image/jpeg
- style
- normal
- variant
- ORTHOIMAGERY.ORTHOPHOTOS2001
- TileMatrixSet
- PM
-
xyzservices.TileProviderGeoportailFrance.Orthoimagery_Orthophotos2002
- url
- https://wxs.ign.fr/{apikey}/geoportail/wmts?REQUEST=GetTile&SERVICE=WMTS&VERSION=1.0.0&STYLE={style}&TILEMATRIXSET={TileMatrixSet}&FORMAT={format}&LAYER={variant}&TILEMATRIX={z}&TILEROW={y}&TILECOL={x}
- html_attribution
- Geoportail France
- attribution
- Geoportail France
- bounds
- [[4.49867, -61.2472], [50.3765, 9.68861]]
- min_zoom
- 0
- max_zoom
- 18
- apikey
- orthohisto
- format
- image/jpeg
- style
- normal
- variant
- ORTHOIMAGERY.ORTHOPHOTOS2002
- TileMatrixSet
- PM
-
xyzservices.TileProviderGeoportailFrance.Orthoimagery_Orthophotos2003
- url
- https://wxs.ign.fr/{apikey}/geoportail/wmts?REQUEST=GetTile&SERVICE=WMTS&VERSION=1.0.0&STYLE={style}&TILEMATRIXSET={TileMatrixSet}&FORMAT={format}&LAYER={variant}&TILEMATRIX={z}&TILEROW={y}&TILECOL={x}
- html_attribution
- Geoportail France
- attribution
- Geoportail France
- bounds
- [[-75.0, -179.5], [75.0, 179.5]]
- min_zoom
- 0
- max_zoom
- 18
- apikey
- orthohisto
- format
- image/jpeg
- style
- normal
- variant
- ORTHOIMAGERY.ORTHOPHOTOS2003
- TileMatrixSet
- PM
-
xyzservices.TileProviderGeoportailFrance.Orthoimagery_Orthophotos2004
- url
- https://wxs.ign.fr/{apikey}/geoportail/wmts?REQUEST=GetTile&SERVICE=WMTS&VERSION=1.0.0&STYLE={style}&TILEMATRIXSET={TileMatrixSet}&FORMAT={format}&LAYER={variant}&TILEMATRIX={z}&TILEROW={y}&TILECOL={x}
- html_attribution
- Geoportail France
- attribution
- Geoportail France
- bounds
- [[-21.4013, -178.187], [51.091, 55.8561]]
- min_zoom
- 0
- max_zoom
- 18
- apikey
- orthohisto
- format
- image/jpeg
- style
- normal
- variant
- ORTHOIMAGERY.ORTHOPHOTOS2004
- TileMatrixSet
- PM
-
xyzservices.TileProviderGeoportailFrance.Orthoimagery_Orthophotos2005
- url
- https://wxs.ign.fr/{apikey}/geoportail/wmts?REQUEST=GetTile&SERVICE=WMTS&VERSION=1.0.0&STYLE={style}&TILEMATRIXSET={TileMatrixSet}&FORMAT={format}&LAYER={variant}&TILEMATRIX={z}&TILEROW={y}&TILECOL={x}
- html_attribution
- Geoportail France
- attribution
- Geoportail France
- bounds
- [[-21.4013, -178.187], [51.091, 55.8561]]
- min_zoom
- 0
- max_zoom
- 18
- apikey
- orthohisto
- format
- image/jpeg
- style
- normal
- variant
- ORTHOIMAGERY.ORTHOPHOTOS2005
- TileMatrixSet
- PM
-
xyzservices.TileProviderGeoportailFrance.Orthoimagery_Orthophotos2006
- url
- https://wxs.ign.fr/{apikey}/geoportail/wmts?REQUEST=GetTile&SERVICE=WMTS&VERSION=1.0.0&STYLE={style}&TILEMATRIXSET={TileMatrixSet}&FORMAT={format}&LAYER={variant}&TILEMATRIX={z}&TILEROW={y}&TILECOL={x}
- html_attribution
- Geoportail France
- attribution
- Geoportail France
- bounds
- [[-21.4013, -178.187], [51.091, 55.8561]]
- min_zoom
- 0
- max_zoom
- 18
- apikey
- orthohisto
- format
- image/jpeg
- style
- normal
- variant
- ORTHOIMAGERY.ORTHOPHOTOS2006
- TileMatrixSet
- PM
-
xyzservices.TileProviderGeoportailFrance.Orthoimagery_Orthophotos2006_2010
- url
- https://wxs.ign.fr/{apikey}/geoportail/wmts?REQUEST=GetTile&SERVICE=WMTS&VERSION=1.0.0&STYLE={style}&TILEMATRIXSET={TileMatrixSet}&FORMAT={format}&LAYER={variant}&TILEMATRIX={z}&TILEROW={y}&TILECOL={x}
- html_attribution
- Geoportail France
- attribution
- Geoportail France
- bounds
- [[-75.0, -179.5], [75.0, 179.5]]
- min_zoom
- 0
- max_zoom
- 18
- apikey
- orthohisto
- format
- image/jpeg
- style
- normal
- variant
- ORTHOIMAGERY.ORTHOPHOTOS2006-2010
- TileMatrixSet
- PM
-
xyzservices.TileProviderGeoportailFrance.Orthoimagery_Orthophotos2007
- url
- https://wxs.ign.fr/{apikey}/geoportail/wmts?REQUEST=GetTile&SERVICE=WMTS&VERSION=1.0.0&STYLE={style}&TILEMATRIXSET={TileMatrixSet}&FORMAT={format}&LAYER={variant}&TILEMATRIX={z}&TILEROW={y}&TILECOL={x}
- html_attribution
- Geoportail France
- attribution
- Geoportail France
- bounds
- [[-75.0, -179.5], [75.0, 179.5]]
- min_zoom
- 0
- max_zoom
- 18
- apikey
- orthohisto
- format
- image/jpeg
- style
- normal
- variant
- ORTHOIMAGERY.ORTHOPHOTOS2007
- TileMatrixSet
- PM
-
xyzservices.TileProviderGeoportailFrance.Orthoimagery_Orthophotos2008
- url
- https://wxs.ign.fr/{apikey}/geoportail/wmts?REQUEST=GetTile&SERVICE=WMTS&VERSION=1.0.0&STYLE={style}&TILEMATRIXSET={TileMatrixSet}&FORMAT={format}&LAYER={variant}&TILEMATRIX={z}&TILEROW={y}&TILECOL={x}
- html_attribution
- Geoportail France
- attribution
- Geoportail France
- bounds
- [[-21.4013, -178.187], [51.091, 55.8561]]
- min_zoom
- 0
- max_zoom
- 18
- apikey
- orthohisto
- format
- image/jpeg
- style
- normal
- variant
- ORTHOIMAGERY.ORTHOPHOTOS2008
- TileMatrixSet
- PM
-
xyzservices.TileProviderGeoportailFrance.Orthoimagery_Orthophotos2009
- url
- https://wxs.ign.fr/{apikey}/geoportail/wmts?REQUEST=GetTile&SERVICE=WMTS&VERSION=1.0.0&STYLE={style}&TILEMATRIXSET={TileMatrixSet}&FORMAT={format}&LAYER={variant}&TILEMATRIX={z}&TILEROW={y}&TILECOL={x}
- html_attribution
- Geoportail France
- attribution
- Geoportail France
- bounds
- [[-75.0, -179.5], [75.0, 179.5]]
- min_zoom
- 0
- max_zoom
- 18
- apikey
- orthohisto
- format
- image/jpeg
- style
- normal
- variant
- ORTHOIMAGERY.ORTHOPHOTOS2009
- TileMatrixSet
- PM
-
xyzservices.TileProviderGeoportailFrance.Orthoimagery_Orthophotos2010
- url
- https://wxs.ign.fr/{apikey}/geoportail/wmts?REQUEST=GetTile&SERVICE=WMTS&VERSION=1.0.0&STYLE={style}&TILEMATRIXSET={TileMatrixSet}&FORMAT={format}&LAYER={variant}&TILEMATRIX={z}&TILEROW={y}&TILECOL={x}
- html_attribution
- Geoportail France
- attribution
- Geoportail France
- bounds
- [[-75.0, -179.5], [75.0, 179.5]]
- min_zoom
- 0
- max_zoom
- 18
- apikey
- orthohisto
- format
- image/jpeg
- style
- normal
- variant
- ORTHOIMAGERY.ORTHOPHOTOS2010
- TileMatrixSet
- PM
-
xyzservices.TileProviderGeoportailFrance.Orthoimagery_Orthophotos2011
- url
- https://wxs.ign.fr/{apikey}/geoportail/wmts?REQUEST=GetTile&SERVICE=WMTS&VERSION=1.0.0&STYLE={style}&TILEMATRIXSET={TileMatrixSet}&FORMAT={format}&LAYER={variant}&TILEMATRIX={z}&TILEROW={y}&TILECOL={x}
- html_attribution
- Geoportail France
- attribution
- Geoportail France
- bounds
- [[-75.0, -179.5], [75.0, 179.5]]
- min_zoom
- 0
- max_zoom
- 18
- apikey
- orthohisto
- format
- image/jpeg
- style
- normal
- variant
- ORTHOIMAGERY.ORTHOPHOTOS2011
- TileMatrixSet
- PM
-
xyzservices.TileProviderGeoportailFrance.Orthoimagery_Orthophotos2011_2015
- url
- https://wxs.ign.fr/{apikey}/geoportail/wmts?REQUEST=GetTile&SERVICE=WMTS&VERSION=1.0.0&STYLE={style}&TILEMATRIXSET={TileMatrixSet}&FORMAT={format}&LAYER={variant}&TILEMATRIX={z}&TILEROW={y}&TILECOL={x}
- html_attribution
- Geoportail France
- attribution
- Geoportail France
- bounds
- [[-21.4013, -178.187], [51.0945, 55.8561]]
- min_zoom
- 6
- max_zoom
- 18
- apikey
- orthohisto
- format
- image/jpeg
- style
- normal
- variant
- ORTHOIMAGERY.ORTHOPHOTOS2011-2015
- TileMatrixSet
- PM
-
xyzservices.TileProviderGeoportailFrance.Orthoimagery_Orthophotos2012
- url
- https://wxs.ign.fr/{apikey}/geoportail/wmts?REQUEST=GetTile&SERVICE=WMTS&VERSION=1.0.0&STYLE={style}&TILEMATRIXSET={TileMatrixSet}&FORMAT={format}&LAYER={variant}&TILEMATRIX={z}&TILEROW={y}&TILECOL={x}
- html_attribution
- Geoportail France
- attribution
- Geoportail France
- bounds
- [[-75.0, -179.5], [75.0, 179.5]]
- min_zoom
- 0
- max_zoom
- 18
- apikey
- orthohisto
- format
- image/jpeg
- style
- normal
- variant
- ORTHOIMAGERY.ORTHOPHOTOS2012
- TileMatrixSet
- PM
-
xyzservices.TileProviderGeoportailFrance.Orthoimagery_Orthophotos2013
- url
- https://wxs.ign.fr/{apikey}/geoportail/wmts?REQUEST=GetTile&SERVICE=WMTS&VERSION=1.0.0&STYLE={style}&TILEMATRIXSET={TileMatrixSet}&FORMAT={format}&LAYER={variant}&TILEMATRIX={z}&TILEROW={y}&TILECOL={x}
- html_attribution
- Geoportail France
- attribution
- Geoportail France
- bounds
- [[-75.0, -179.5], [75.0, 179.5]]
- min_zoom
- 0
- max_zoom
- 18
- apikey
- orthohisto
- format
- image/jpeg
- style
- normal
- variant
- ORTHOIMAGERY.ORTHOPHOTOS2013
- TileMatrixSet
- PM
-
xyzservices.TileProviderGeoportailFrance.Orthoimagery_Orthophotos2014
- url
- https://wxs.ign.fr/{apikey}/geoportail/wmts?REQUEST=GetTile&SERVICE=WMTS&VERSION=1.0.0&STYLE={style}&TILEMATRIXSET={TileMatrixSet}&FORMAT={format}&LAYER={variant}&TILEMATRIX={z}&TILEROW={y}&TILECOL={x}
- html_attribution
- Geoportail France
- attribution
- Geoportail France
- bounds
- [[-75.0, -179.5], [75.0, 179.5]]
- min_zoom
- 0
- max_zoom
- 18
- apikey
- orthohisto
- format
- image/jpeg
- style
- normal
- variant
- ORTHOIMAGERY.ORTHOPHOTOS2014
- TileMatrixSet
- PM
-
xyzservices.TileProviderGeoportailFrance.Orthoimagery_Orthophotos2015
- url
- https://wxs.ign.fr/{apikey}/geoportail/wmts?REQUEST=GetTile&SERVICE=WMTS&VERSION=1.0.0&STYLE={style}&TILEMATRIXSET={TileMatrixSet}&FORMAT={format}&LAYER={variant}&TILEMATRIX={z}&TILEROW={y}&TILECOL={x}
- html_attribution
- Geoportail France
- attribution
- Geoportail France
- bounds
- [[-75.0, -179.5], [75.0, 179.5]]
- min_zoom
- 0
- max_zoom
- 18
- apikey
- orthohisto
- format
- image/jpeg
- style
- normal
- variant
- ORTHOIMAGERY.ORTHOPHOTOS2015
- TileMatrixSet
- PM
-
xyzservices.TileProviderGeoportailFrance.Orthoimagery_Orthophotos2016
- url
- https://wxs.ign.fr/{apikey}/geoportail/wmts?REQUEST=GetTile&SERVICE=WMTS&VERSION=1.0.0&STYLE={style}&TILEMATRIXSET={TileMatrixSet}&FORMAT={format}&LAYER={variant}&TILEMATRIX={z}&TILEROW={y}&TILECOL={x}
- html_attribution
- Geoportail France
- attribution
- Geoportail France
- bounds
- [[-75.0, -179.5], [75.0, 179.5]]
- min_zoom
- 0
- max_zoom
- 18
- apikey
- orthohisto
- format
- image/jpeg
- style
- normal
- variant
- ORTHOIMAGERY.ORTHOPHOTOS2016
- TileMatrixSet
- PM
-
xyzservices.TileProviderGeoportailFrance.Orthoimagery_Orthophotos2017
- url
- https://wxs.ign.fr/{apikey}/geoportail/wmts?REQUEST=GetTile&SERVICE=WMTS&VERSION=1.0.0&STYLE={style}&TILEMATRIXSET={TileMatrixSet}&FORMAT={format}&LAYER={variant}&TILEMATRIX={z}&TILEROW={y}&TILECOL={x}
- html_attribution
- Geoportail France
- attribution
- Geoportail France
- bounds
- [[-21.4013, -63.1607], [50.3856, 55.8464]]
- min_zoom
- 6
- max_zoom
- 18
- apikey
- orthohisto
- format
- image/jpeg
- style
- normal
- variant
- ORTHOIMAGERY.ORTHOPHOTOS2017
- TileMatrixSet
- PM
-
xyzservices.TileProviderGeoportailFrance.Orthoimagery_Orthophotos2018
- url
- https://wxs.ign.fr/{apikey}/geoportail/wmts?REQUEST=GetTile&SERVICE=WMTS&VERSION=1.0.0&STYLE={style}&TILEMATRIXSET={TileMatrixSet}&FORMAT={format}&LAYER={variant}&TILEMATRIX={z}&TILEROW={y}&TILECOL={x}
- html_attribution
- Geoportail France
- attribution
- Geoportail France
- bounds
- [[42.3163, -5.20863], [51.1124, 8.25765]]
- min_zoom
- 6
- max_zoom
- 18
- apikey
- orthohisto
- format
- image/jpeg
- style
- normal
- variant
- ORTHOIMAGERY.ORTHOPHOTOS2018
- TileMatrixSet
- PM
-
xyzservices.TileProviderGeoportailFrance.Orthoimagery_Orthophotos2019
- url
- https://wxs.ign.fr/{apikey}/geoportail/wmts?REQUEST=GetTile&SERVICE=WMTS&VERSION=1.0.0&STYLE={style}&TILEMATRIXSET={TileMatrixSet}&FORMAT={format}&LAYER={variant}&TILEMATRIX={z}&TILEROW={y}&TILECOL={x}
- html_attribution
- Geoportail France
- attribution
- Geoportail France
- bounds
- [[41.3125, -3.74871], [50.1928, 9.66314]]
- min_zoom
- 6
- max_zoom
- 18
- apikey
- orthohisto
- format
- image/jpeg
- style
- normal
- variant
- ORTHOIMAGERY.ORTHOPHOTOS2019
- TileMatrixSet
- PM
-
xyzservices.TileProviderGeoportailFrance.Orthoimagery_Orthophotos2020
- url
- https://wxs.ign.fr/{apikey}/geoportail/wmts?REQUEST=GetTile&SERVICE=WMTS&VERSION=1.0.0&STYLE={style}&TILEMATRIXSET={TileMatrixSet}&FORMAT={format}&LAYER={variant}&TILEMATRIX={z}&TILEROW={y}&TILECOL={x}
- html_attribution
- Geoportail France
- attribution
- Geoportail France
- bounds
- [[42.9454, -2.68142], [49.4512, 7.74363]]
- min_zoom
- 6
- max_zoom
- 19
- apikey
- orthohisto
- format
- image/jpeg
- style
- normal
- variant
- ORTHOIMAGERY.ORTHOPHOTOS2020
- TileMatrixSet
- PM
-
xyzservices.TileProviderGeoportailFrance.Orthoimagery_Ortho_sat_Pleiades_2012
- url
- https://wxs.ign.fr/{apikey}/geoportail/wmts?REQUEST=GetTile&SERVICE=WMTS&VERSION=1.0.0&STYLE={style}&TILEMATRIXSET={TileMatrixSet}&FORMAT={format}&LAYER={variant}&TILEMATRIX={z}&TILEROW={y}&TILECOL={x}
- html_attribution
- Geoportail France
- attribution
- Geoportail France
- bounds
- [[-21.3539, -53.2686], [50.6037, 55.5544]]
- min_zoom
- 0
- max_zoom
- 18
- apikey
- satellite
- format
- image/png
- style
- normal
- variant
- ORTHOIMAGERY.ORTHO-SAT.PLEIADES.2012
- TileMatrixSet
- PM
-
xyzservices.TileProviderGeoportailFrance.Orthoimagery_Ortho_sat_Pleiades_2013
- url
- https://wxs.ign.fr/{apikey}/geoportail/wmts?REQUEST=GetTile&SERVICE=WMTS&VERSION=1.0.0&STYLE={style}&TILEMATRIXSET={TileMatrixSet}&FORMAT={format}&LAYER={variant}&TILEMATRIX={z}&TILEROW={y}&TILECOL={x}
- html_attribution
- Geoportail France
- attribution
- Geoportail France
- bounds
- [[-75.0, -179.5], [75.0, 179.5]]
- min_zoom
- 0
- max_zoom
- 18
- apikey
- satellite
- format
- image/png
- style
- normal
- variant
- ORTHOIMAGERY.ORTHO-SAT.PLEIADES.2013
- TileMatrixSet
- PM
-
xyzservices.TileProviderGeoportailFrance.Orthoimagery_Ortho_sat_Pleiades_2014
- url
- https://wxs.ign.fr/{apikey}/geoportail/wmts?REQUEST=GetTile&SERVICE=WMTS&VERSION=1.0.0&STYLE={style}&TILEMATRIXSET={TileMatrixSet}&FORMAT={format}&LAYER={variant}&TILEMATRIX={z}&TILEROW={y}&TILECOL={x}
- html_attribution
- Geoportail France
- attribution
- Geoportail France
- bounds
- [[-75.0, -179.5], [75.0, 179.5]]
- min_zoom
- 0
- max_zoom
- 18
- apikey
- satellite
- format
- image/png
- style
- normal
- variant
- ORTHOIMAGERY.ORTHO-SAT.PLEIADES.2014
- TileMatrixSet
- PM
-
xyzservices.TileProviderGeoportailFrance.Orthoimagery_Ortho_sat_Pleiades_2015
- url
- https://wxs.ign.fr/{apikey}/geoportail/wmts?REQUEST=GetTile&SERVICE=WMTS&VERSION=1.0.0&STYLE={style}&TILEMATRIXSET={TileMatrixSet}&FORMAT={format}&LAYER={variant}&TILEMATRIX={z}&TILEROW={y}&TILECOL={x}
- html_attribution
- Geoportail France
- attribution
- Geoportail France
- bounds
- [[-75.0, -179.5], [75.0, 179.5]]
- min_zoom
- 0
- max_zoom
- 18
- apikey
- satellite
- format
- image/png
- style
- normal
- variant
- ORTHOIMAGERY.ORTHO-SAT.PLEIADES.2015
- TileMatrixSet
- PM
-
xyzservices.TileProviderGeoportailFrance.Orthoimagery_Ortho_sat_Pleiades_2016
- url
- https://wxs.ign.fr/{apikey}/geoportail/wmts?REQUEST=GetTile&SERVICE=WMTS&VERSION=1.0.0&STYLE={style}&TILEMATRIXSET={TileMatrixSet}&FORMAT={format}&LAYER={variant}&TILEMATRIX={z}&TILEROW={y}&TILECOL={x}
- html_attribution
- Geoportail France
- attribution
- Geoportail France
- bounds
- [[-21.32, -54.1373], [50.6549, 55.8441]]
- min_zoom
- 0
- max_zoom
- 18
- apikey
- satellite
- format
- image/png
- style
- normal
- variant
- ORTHOIMAGERY.ORTHO-SAT.PLEIADES.2016
- TileMatrixSet
- PM
-
xyzservices.TileProviderGeoportailFrance.Orthoimagery_Ortho_sat_Pleiades_2017
- url
- https://wxs.ign.fr/{apikey}/geoportail/wmts?REQUEST=GetTile&SERVICE=WMTS&VERSION=1.0.0&STYLE={style}&TILEMATRIXSET={TileMatrixSet}&FORMAT={format}&LAYER={variant}&TILEMATRIX={z}&TILEROW={y}&TILECOL={x}
- html_attribution
- Geoportail France
- attribution
- Geoportail France
- bounds
- [[-21.4013, -63.1796], [51.1117, 55.8465]]
- min_zoom
- 0
- max_zoom
- 18
- apikey
- satellite
- format
- image/png
- style
- normal
- variant
- ORTHOIMAGERY.ORTHO-SAT.PLEIADES.2017
- TileMatrixSet
- PM
-
xyzservices.TileProviderGeoportailFrance.Orthoimagery_Ortho_sat_Pleiades_2018
- url
- https://wxs.ign.fr/{apikey}/geoportail/wmts?REQUEST=GetTile&SERVICE=WMTS&VERSION=1.0.0&STYLE={style}&TILEMATRIXSET={TileMatrixSet}&FORMAT={format}&LAYER={variant}&TILEMATRIX={z}&TILEROW={y}&TILECOL={x}
- html_attribution
- Geoportail France
- attribution
- Geoportail France
- bounds
- [[-21.4094, -63.1702], [51.0841, 55.8649]]
- min_zoom
- 0
- max_zoom
- 18
- apikey
- satellite
- format
- image/png
- style
- normal
- variant
- ORTHOIMAGERY.ORTHO-SAT.PLEIADES.2018
- TileMatrixSet
- PM
-
xyzservices.TileProviderGeoportailFrance.Orthoimagery_Ortho_sat_Pleiades_2019
- url
- https://wxs.ign.fr/{apikey}/geoportail/wmts?REQUEST=GetTile&SERVICE=WMTS&VERSION=1.0.0&STYLE={style}&TILEMATRIXSET={TileMatrixSet}&FORMAT={format}&LAYER={variant}&TILEMATRIX={z}&TILEROW={y}&TILECOL={x}
- html_attribution
- Geoportail France
- attribution
- Geoportail France
- bounds
- [[-21.4094, -63.1702], [51.1117, 55.8649]]
- min_zoom
- 0
- max_zoom
- 18
- apikey
- satellite
- format
- image/png
- style
- normal
- variant
- ORTHOIMAGERY.ORTHO-SAT.PLEIADES.2019
- TileMatrixSet
- PM
-
xyzservices.TileProviderGeoportailFrance.Orthoimagery_Ortho_sat_Pleiades_2020
- url
- https://wxs.ign.fr/{apikey}/geoportail/wmts?REQUEST=GetTile&SERVICE=WMTS&VERSION=1.0.0&STYLE={style}&TILEMATRIXSET={TileMatrixSet}&FORMAT={format}&LAYER={variant}&TILEMATRIX={z}&TILEROW={y}&TILECOL={x}
- html_attribution
- Geoportail France
- attribution
- Geoportail France
- bounds
- [[-13.0169, -63.1724], [51.1117, 45.3136]]
- min_zoom
- 0
- max_zoom
- 18
- apikey
- satellite
- format
- image/png
- style
- normal
- variant
- ORTHOIMAGERY.ORTHO-SAT.PLEIADES.2020
- TileMatrixSet
- PM
-
xyzservices.TileProviderGeoportailFrance.Orthoimagery_Ortho_sat_Pleiades_2021
- url
- https://wxs.ign.fr/{apikey}/geoportail/wmts?REQUEST=GetTile&SERVICE=WMTS&VERSION=1.0.0&STYLE={style}&TILEMATRIXSET={TileMatrixSet}&FORMAT={format}&LAYER={variant}&TILEMATRIX={z}&TILEROW={y}&TILECOL={x}
- html_attribution
- Geoportail France
- attribution
- Geoportail France
- bounds
- [[-75.0, -179.5], [75.0, 179.5]]
- min_zoom
- 0
- max_zoom
- 19
- apikey
- satellite
- format
- image/png
- style
- normal
- variant
- ORTHOIMAGERY.ORTHO-SAT.PLEIADES.2021
- TileMatrixSet
- PM
-
xyzservices.TileProviderGeoportailFrance.Orthoimagery_Ortho_sat_Pleiades_2022
- url
- https://wxs.ign.fr/{apikey}/geoportail/wmts?REQUEST=GetTile&SERVICE=WMTS&VERSION=1.0.0&STYLE={style}&TILEMATRIXSET={TileMatrixSet}&FORMAT={format}&LAYER={variant}&TILEMATRIX={z}&TILEROW={y}&TILECOL={x}
- html_attribution
- Geoportail France
- attribution
- Geoportail France
- bounds
- [[-21.3733, -67.7132], [69.3108, 55.7216]]
- min_zoom
- 0
- max_zoom
- 18
- apikey
- satellite
- format
- image/png
- style
- normal
- variant
- ORTHOIMAGERY.ORTHO-SAT.PLEIADES.2022
- TileMatrixSet
- PM
-
xyzservices.TileProviderGeoportailFrance.Orthoimagery_Ortho_sat_Rapideye_2010
- url
- https://wxs.ign.fr/{apikey}/geoportail/wmts?REQUEST=GetTile&SERVICE=WMTS&VERSION=1.0.0&STYLE={style}&TILEMATRIXSET={TileMatrixSet}&FORMAT={format}&LAYER={variant}&TILEMATRIX={z}&TILEROW={y}&TILECOL={x}
- html_attribution
- Geoportail France
- attribution
- Geoportail France
- bounds
- [[41.2014, -5.80725], [50.9218, 10.961]]
- min_zoom
- 0
- max_zoom
- 15
- apikey
- satellite
- format
- image/jpeg
- style
- normal
- variant
- ORTHOIMAGERY.ORTHO-SAT.RAPIDEYE.2010
- TileMatrixSet
- PM
-
xyzservices.TileProviderGeoportailFrance.Orthoimagery_Ortho_sat_Rapideye_2011
- url
- https://wxs.ign.fr/{apikey}/geoportail/wmts?REQUEST=GetTile&SERVICE=WMTS&VERSION=1.0.0&STYLE={style}&TILEMATRIXSET={TileMatrixSet}&FORMAT={format}&LAYER={variant}&TILEMATRIX={z}&TILEROW={y}&TILECOL={x}
- html_attribution
- Geoportail France
- attribution
- Geoportail France
- bounds
- [[41.0227, -5.80725], [51.1752, 10.961]]
- min_zoom
- 0
- max_zoom
- 15
- apikey
- satellite
- format
- image/jpeg
- style
- normal
- variant
- ORTHOIMAGERY.ORTHO-SAT.RAPIDEYE.2011
- TileMatrixSet
- PM
-
xyzservices.TileProviderGeoportailFrance.Orthoimagery_Ortho_sat_Spot_2013
- url
- https://wxs.ign.fr/{apikey}/geoportail/wmts?REQUEST=GetTile&SERVICE=WMTS&VERSION=1.0.0&STYLE={style}&TILEMATRIXSET={TileMatrixSet}&FORMAT={format}&LAYER={variant}&TILEMATRIX={z}&TILEROW={y}&TILECOL={x}
- html_attribution
- Geoportail France
- attribution
- Geoportail France
- bounds
- [[44.8809, 0.563585], [50.3879, 4.29191]]
- min_zoom
- 0
- max_zoom
- 17
- apikey
- satellite
- format
- image/jpeg
- style
- normal
- variant
- ORTHOIMAGERY.ORTHO-SAT.SPOT.2013
- TileMatrixSet
- PM
- status
- broken
-
xyzservices.TileProviderGeoportailFrance.Orthoimagery_Ortho_sat_Spot_2014
- url
- https://wxs.ign.fr/{apikey}/geoportail/wmts?REQUEST=GetTile&SERVICE=WMTS&VERSION=1.0.0&STYLE={style}&TILEMATRIXSET={TileMatrixSet}&FORMAT={format}&LAYER={variant}&TILEMATRIX={z}&TILEROW={y}&TILECOL={x}
- html_attribution
- Geoportail France
- attribution
- Geoportail France
- bounds
- [[-75.0, -179.5], [75.0, 179.5]]
- min_zoom
- 0
- max_zoom
- 17
- apikey
- satellite
- format
- image/jpeg
- style
- normal
- variant
- ORTHOIMAGERY.ORTHO-SAT.SPOT.2014
- TileMatrixSet
- PM
-
xyzservices.TileProviderGeoportailFrance.Orthoimagery_Ortho_sat_Spot_2015
- url
- https://wxs.ign.fr/{apikey}/geoportail/wmts?REQUEST=GetTile&SERVICE=WMTS&VERSION=1.0.0&STYLE={style}&TILEMATRIXSET={TileMatrixSet}&FORMAT={format}&LAYER={variant}&TILEMATRIX={z}&TILEROW={y}&TILECOL={x}
- html_attribution
- Geoportail France
- attribution
- Geoportail France
- bounds
- [[-21.4104, -61.8141], [51.106, 55.856]]
- min_zoom
- 0
- max_zoom
- 17
- apikey
- satellite
- format
- image/jpeg
- style
- normal
- variant
- ORTHOIMAGERY.ORTHO-SAT.SPOT.2015
- TileMatrixSet
- PM
-
xyzservices.TileProviderGeoportailFrance.Orthoimagery_Ortho_sat_Spot_2016
- url
- https://wxs.ign.fr/{apikey}/geoportail/wmts?REQUEST=GetTile&SERVICE=WMTS&VERSION=1.0.0&STYLE={style}&TILEMATRIXSET={TileMatrixSet}&FORMAT={format}&LAYER={variant}&TILEMATRIX={z}&TILEROW={y}&TILECOL={x}
- html_attribution
- Geoportail France
- attribution
- Geoportail France
- bounds
- [[-21.4104, -61.85], [51.1123, 55.8562]]
- min_zoom
- 0
- max_zoom
- 17
- apikey
- satellite
- format
- image/jpeg
- style
- normal
- variant
- ORTHOIMAGERY.ORTHO-SAT.SPOT.2016
- TileMatrixSet
- PM
-
xyzservices.TileProviderGeoportailFrance.Orthoimagery_Ortho_sat_Spot_2017
- url
- https://wxs.ign.fr/{apikey}/geoportail/wmts?REQUEST=GetTile&SERVICE=WMTS&VERSION=1.0.0&STYLE={style}&TILEMATRIXSET={TileMatrixSet}&FORMAT={format}&LAYER={variant}&TILEMATRIX={z}&TILEROW={y}&TILECOL={x}
- html_attribution
- Geoportail France
- attribution
- Geoportail France
- bounds
- [[-21.4104, -61.8534], [51.1123, 55.8562]]
- min_zoom
- 0
- max_zoom
- 17
- apikey
- satellite
- format
- image/jpeg
- style
- normal
- variant
- ORTHOIMAGERY.ORTHO-SAT.SPOT.2017
- TileMatrixSet
- PM
-
xyzservices.TileProviderGeoportailFrance.Orthoimagery_Ortho_sat_Spot_2018
- url
- https://wxs.ign.fr/{apikey}/geoportail/wmts?REQUEST=GetTile&SERVICE=WMTS&VERSION=1.0.0&STYLE={style}&TILEMATRIXSET={TileMatrixSet}&FORMAT={format}&LAYER={variant}&TILEMATRIX={z}&TILEROW={y}&TILECOL={x}
- html_attribution
- Geoportail France
- attribution
- Geoportail France
- bounds
- [[41.2593, -5.57103], [51.1123, 10.7394]]
- min_zoom
- 0
- max_zoom
- 17
- apikey
- satellite
- format
- image/jpeg
- style
- normal
- variant
- ORTHOIMAGERY.ORTHO-SAT.SPOT.2018
- TileMatrixSet
- PM
-
xyzservices.TileProviderGeoportailFrance.Orthoimagery_Ortho_sat_Spot_2019
- url
- https://wxs.ign.fr/{apikey}/geoportail/wmts?REQUEST=GetTile&SERVICE=WMTS&VERSION=1.0.0&STYLE={style}&TILEMATRIXSET={TileMatrixSet}&FORMAT={format}&LAYER={variant}&TILEMATRIX={z}&TILEROW={y}&TILECOL={x}
- html_attribution
- Geoportail France
- attribution
- Geoportail France
- bounds
- [[41.2593, -5.57103], [51.1123, 10.7394]]
- min_zoom
- 0
- max_zoom
- 17
- apikey
- satellite
- format
- image/jpeg
- style
- normal
- variant
- ORTHOIMAGERY.ORTHO-SAT.SPOT.2019
- TileMatrixSet
- PM
-
xyzservices.TileProviderGeoportailFrance.Orthoimagery_Ortho_sat_Spot_2020
- url
- https://wxs.ign.fr/{apikey}/geoportail/wmts?REQUEST=GetTile&SERVICE=WMTS&VERSION=1.0.0&STYLE={style}&TILEMATRIXSET={TileMatrixSet}&FORMAT={format}&LAYER={variant}&TILEMATRIX={z}&TILEROW={y}&TILECOL={x}
- html_attribution
- Geoportail France
- attribution
- Geoportail France
- bounds
- [[41.2593, -5.57103], [51.1123, 10.7394]]
- min_zoom
- 0
- max_zoom
- 17
- apikey
- satellite
- format
- image/jpeg
- style
- normal
- variant
- ORTHOIMAGERY.ORTHO-SAT.SPOT.2020
- TileMatrixSet
- PM
-
xyzservices.TileProviderGeoportailFrance.Orthoimagery_Ortho_sat_Spot_2021
- url
- https://wxs.ign.fr/{apikey}/geoportail/wmts?REQUEST=GetTile&SERVICE=WMTS&VERSION=1.0.0&STYLE={style}&TILEMATRIXSET={TileMatrixSet}&FORMAT={format}&LAYER={variant}&TILEMATRIX={z}&TILEROW={y}&TILECOL={x}
- html_attribution
- Geoportail France
- attribution
- Geoportail France
- bounds
- [[41.2593, -5.57103], [51.1123, 10.7394]]
- min_zoom
- 0
- max_zoom
- 17
- apikey
- satellite
- format
- image/jpeg
- style
- normal
- variant
- ORTHOIMAGERY.ORTHO-SAT.SPOT.2021
- TileMatrixSet
- PM
-
xyzservices.TileProviderGeoportailFrance.Bdcarto_etat_major_Niveau3
- url
- https://wxs.ign.fr/{apikey}/geoportail/wmts?REQUEST=GetTile&SERVICE=WMTS&VERSION=1.0.0&STYLE={style}&TILEMATRIXSET={TileMatrixSet}&FORMAT={format}&LAYER={variant}&TILEMATRIX={z}&TILEROW={y}&TILECOL={x}
- html_attribution
- Geoportail France
- attribution
- Geoportail France
- bounds
- [[42.3263, -5.15012], [51.0938, 7.19384]]
- min_zoom
- 6
- max_zoom
- 16
- apikey
- sol
- format
- image/png
- style
- normal
- variant
- BDCARTO_ETAT-MAJOR.NIVEAU3
- TileMatrixSet
- PM
-
xyzservices.TileProviderGeoportailFrance.Bdcarto_etat_major_Niveau4
- url
- https://wxs.ign.fr/{apikey}/geoportail/wmts?REQUEST=GetTile&SERVICE=WMTS&VERSION=1.0.0&STYLE={style}&TILEMATRIXSET={TileMatrixSet}&FORMAT={format}&LAYER={variant}&TILEMATRIX={z}&TILEROW={y}&TILECOL={x}
- html_attribution
- Geoportail France
- attribution
- Geoportail France
- bounds
- [[41.3252, -5.15047], [51.0991, 9.57054]]
- min_zoom
- 6
- max_zoom
- 16
- apikey
- sol
- format
- image/png
- style
- normal
- variant
- BDCARTO_ETAT-MAJOR.NIVEAU4
- TileMatrixSet
- PM
-
xyzservices.TileProviderGeoportailFrance.Buildings_Buildings
- url
- https://wxs.ign.fr/{apikey}/geoportail/wmts?REQUEST=GetTile&SERVICE=WMTS&VERSION=1.0.0&STYLE={style}&TILEMATRIXSET={TileMatrixSet}&FORMAT={format}&LAYER={variant}&TILEMATRIX={z}&TILEROW={y}&TILECOL={x}
- html_attribution
- Geoportail France
- attribution
- Geoportail France
- bounds
- [[-21.4969, -63.9692], [71.5841, 55.9644]]
- min_zoom
- 6
- max_zoom
- 18
- apikey
- topographie
- format
- image/png
- style
- normal
- variant
- BUILDINGS.BUILDINGS
- TileMatrixSet
- PM
-
xyzservices.TileProviderGeoportailFrance.Geographicalnames_Names
- url
- https://wxs.ign.fr/{apikey}/geoportail/wmts?REQUEST=GetTile&SERVICE=WMTS&VERSION=1.0.0&STYLE={style}&TILEMATRIXSET={TileMatrixSet}&FORMAT={format}&LAYER={variant}&TILEMATRIX={z}&TILEROW={y}&TILECOL={x}
- html_attribution
- Geoportail France
- attribution
- Geoportail France
- bounds
- [[-21.4969, -63.9692], [71.5841, 55.9644]]
- min_zoom
- 6
- max_zoom
- 18
- apikey
- topographie
- format
- image/png
- style
- normal
- variant
- GEOGRAPHICALNAMES.NAMES
- TileMatrixSet
- PM
-
xyzservices.TileProviderGeoportailFrance.Hydrography_Hydrography
- url
- https://wxs.ign.fr/{apikey}/geoportail/wmts?REQUEST=GetTile&SERVICE=WMTS&VERSION=1.0.0&STYLE={style}&TILEMATRIXSET={TileMatrixSet}&FORMAT={format}&LAYER={variant}&TILEMATRIX={z}&TILEROW={y}&TILECOL={x}
- html_attribution
- Geoportail France
- attribution
- Geoportail France
- bounds
- [[-21.4969, -63.9692], [71.5841, 55.9644]]
- min_zoom
- 6
- max_zoom
- 18
- apikey
- topographie
- format
- image/png
- style
- normal
- variant
- HYDROGRAPHY.HYDROGRAPHY
- TileMatrixSet
- PM
-
xyzservices.TileProviderGeoportailFrance.Transportnetwork_Commontransportelements_Markerpost
- url
- https://wxs.ign.fr/{apikey}/geoportail/wmts?REQUEST=GetTile&SERVICE=WMTS&VERSION=1.0.0&STYLE={style}&TILEMATRIXSET={TileMatrixSet}&FORMAT={format}&LAYER={variant}&TILEMATRIX={z}&TILEROW={y}&TILECOL={x}
- html_attribution
- Geoportail France
- attribution
- Geoportail France
- bounds
- [[-21.4756, -63.3725], [51.3121, 55.9259]]
- min_zoom
- 10
- max_zoom
- 18
- apikey
- topographie
- format
- image/png
- style
- normal
- variant
- TRANSPORTNETWORK.COMMONTRANSPORTELEMENTS.MARKERPOST
- TileMatrixSet
- PM
-
xyzservices.TileProviderGeoportailFrance.Transportnetworks_Railways
- url
- https://wxs.ign.fr/{apikey}/geoportail/wmts?REQUEST=GetTile&SERVICE=WMTS&VERSION=1.0.0&STYLE={style}&TILEMATRIXSET={TileMatrixSet}&FORMAT={format}&LAYER={variant}&TILEMATRIX={z}&TILEROW={y}&TILECOL={x}
- html_attribution
- Geoportail France
- attribution
- Geoportail France
- bounds
- [[-21.4969, -63.9692], [71.5841, 55.9644]]
- min_zoom
- 6
- max_zoom
- 18
- apikey
- topographie
- format
- image/png
- style
- normal
- variant
- TRANSPORTNETWORKS.RAILWAYS
- TileMatrixSet
- PM
-
xyzservices.TileProviderGeoportailFrance.Transportnetworks_Roads
- url
- https://wxs.ign.fr/{apikey}/geoportail/wmts?REQUEST=GetTile&SERVICE=WMTS&VERSION=1.0.0&STYLE={style}&TILEMATRIXSET={TileMatrixSet}&FORMAT={format}&LAYER={variant}&TILEMATRIX={z}&TILEROW={y}&TILECOL={x}
- html_attribution
- Geoportail France
- attribution
- Geoportail France
- bounds
- [[-21.4969, -63.9692], [71.5841, 55.9644]]
- min_zoom
- 6
- max_zoom
- 18
- apikey
- topographie
- format
- image/png
- style
- normal
- variant
- TRANSPORTNETWORKS.ROADS
- TileMatrixSet
- PM
-
xyzservices.TileProviderGeoportailFrance.Transportnetworks_Runways
- url
- https://wxs.ign.fr/{apikey}/geoportail/wmts?REQUEST=GetTile&SERVICE=WMTS&VERSION=1.0.0&STYLE={style}&TILEMATRIXSET={TileMatrixSet}&FORMAT={format}&LAYER={variant}&TILEMATRIX={z}&TILEROW={y}&TILECOL={x}
- html_attribution
- Geoportail France
- attribution
- Geoportail France
- bounds
- [[-21.4969, -63.9692], [71.5841, 55.9644]]
- min_zoom
- 6
- max_zoom
- 18
- apikey
- topographie
- format
- image/png
- style
- normal
- variant
- TRANSPORTNETWORKS.RUNWAYS
- TileMatrixSet
- PM
-
xyzservices.TileProviderGeoportailFrance.Utilityandgovernmentalservices_All
- url
- https://wxs.ign.fr/{apikey}/geoportail/wmts?REQUEST=GetTile&SERVICE=WMTS&VERSION=1.0.0&STYLE={style}&TILEMATRIXSET={TileMatrixSet}&FORMAT={format}&LAYER={variant}&TILEMATRIX={z}&TILEROW={y}&TILECOL={x}
- html_attribution
- Geoportail France
- attribution
- Geoportail France
- bounds
- [[-21.4756, -63.3725], [71.5841, 55.9259]]
- min_zoom
- 6
- max_zoom
- 18
- apikey
- topographie
- format
- image/png
- style
- normal
- variant
- UTILITYANDGOVERNMENTALSERVICES.ALL
- TileMatrixSet
- PM
-
xyzservices.TileProviderGeoportailFrance.Hedge_Hedge
- url
- https://wxs.ign.fr/{apikey}/geoportail/wmts?REQUEST=GetTile&SERVICE=WMTS&VERSION=1.0.0&STYLE={style}&TILEMATRIXSET={TileMatrixSet}&FORMAT={format}&LAYER={variant}&TILEMATRIX={z}&TILEROW={y}&TILECOL={x}
- html_attribution
- Geoportail France
- attribution
- Geoportail France
- bounds
- [[-21.4756, -63.3725], [51.3121, 55.9259]]
- min_zoom
- 7
- max_zoom
- 18
- apikey
- topographie
- format
- image/png
- style
- normal
- variant
- hedge.hedge
- TileMatrixSet
- PM
-
xyzservices.TileProviderGeoportailFrance.Securoute_Te_1te
- url
- https://wxs.ign.fr/{apikey}/geoportail/wmts?REQUEST=GetTile&SERVICE=WMTS&VERSION=1.0.0&STYLE={style}&TILEMATRIXSET={TileMatrixSet}&FORMAT={format}&LAYER={variant}&TILEMATRIX={z}&TILEROW={y}&TILECOL={x}
- html_attribution
- Geoportail France
- attribution
- Geoportail France
- bounds
- [[-21.4756, -63.3725], [51.3121, 55.9259]]
- min_zoom
- 4
- max_zoom
- 17
- apikey
- transports
- format
- image/png
- style
- RESEAU ROUTIER 1TE
- variant
- SECUROUTE.TE.1TE
- TileMatrixSet
- PM
-
xyzservices.TileProviderGeoportailFrance.Securoute_Te_2te48
- url
- https://wxs.ign.fr/{apikey}/geoportail/wmts?REQUEST=GetTile&SERVICE=WMTS&VERSION=1.0.0&STYLE={style}&TILEMATRIXSET={TileMatrixSet}&FORMAT={format}&LAYER={variant}&TILEMATRIX={z}&TILEROW={y}&TILECOL={x}
- html_attribution
- Geoportail France
- attribution
- Geoportail France
- bounds
- [[-21.4756, -63.3725], [51.3121, 55.9259]]
- min_zoom
- 6
- max_zoom
- 17
- apikey
- transports
- format
- image/png
- style
- RESEAU ROUTIER 2TE48
- variant
- SECUROUTE.TE.2TE48
- TileMatrixSet
- PM
-
xyzservices.TileProviderGeoportailFrance.Securoute_Te_All
- url
- https://wxs.ign.fr/{apikey}/geoportail/wmts?REQUEST=GetTile&SERVICE=WMTS&VERSION=1.0.0&STYLE={style}&TILEMATRIXSET={TileMatrixSet}&FORMAT={format}&LAYER={variant}&TILEMATRIX={z}&TILEROW={y}&TILECOL={x}
- html_attribution
- Geoportail France
- attribution
- Geoportail France
- bounds
- [[-21.4756, -63.3725], [51.3121, 55.9259]]
- min_zoom
- 6
- max_zoom
- 17
- apikey
- transports
- format
- image/png
- style
- TOUS LES FRANCHISSEMENTS
- variant
- SECUROUTE.TE.ALL
- TileMatrixSet
- PM
-
xyzservices.TileProviderGeoportailFrance.Securoute_Te_Oa
- url
- https://wxs.ign.fr/{apikey}/geoportail/wmts?REQUEST=GetTile&SERVICE=WMTS&VERSION=1.0.0&STYLE={style}&TILEMATRIXSET={TileMatrixSet}&FORMAT={format}&LAYER={variant}&TILEMATRIX={z}&TILEROW={y}&TILECOL={x}
- html_attribution
- Geoportail France
- attribution
- Geoportail France
- bounds
- [[-21.4756, -63.3725], [51.3121, 55.9259]]
- min_zoom
- 6
- max_zoom
- 17
- apikey
- transports
- format
- image/png
- style
- AUTRES FRANCHISSEMENTS
- variant
- SECUROUTE.TE.OA
- TileMatrixSet
- PM
-
xyzservices.TileProviderGeoportailFrance.Securoute_Te_Pn
- url
- https://wxs.ign.fr/{apikey}/geoportail/wmts?REQUEST=GetTile&SERVICE=WMTS&VERSION=1.0.0&STYLE={style}&TILEMATRIXSET={TileMatrixSet}&FORMAT={format}&LAYER={variant}&TILEMATRIX={z}&TILEROW={y}&TILECOL={x}
- html_attribution
- Geoportail France
- attribution
- Geoportail France
- bounds
- [[-21.4756, -63.3725], [51.3121, 55.9259]]
- min_zoom
- 6
- max_zoom
- 17
- apikey
- transports
- format
- image/png
- style
- FRANCHISSEMENTS PASSAGE A NIVEAU
- variant
- SECUROUTE.TE.PN
- TileMatrixSet
- PM
-
xyzservices.TileProviderGeoportailFrance.Securoute_Te_Pnd
- url
- https://wxs.ign.fr/{apikey}/geoportail/wmts?REQUEST=GetTile&SERVICE=WMTS&VERSION=1.0.0&STYLE={style}&TILEMATRIXSET={TileMatrixSet}&FORMAT={format}&LAYER={variant}&TILEMATRIX={z}&TILEROW={y}&TILECOL={x}
- html_attribution
- Geoportail France
- attribution
- Geoportail France
- bounds
- [[-21.4756, -63.3725], [51.3121, 55.9259]]
- min_zoom
- 6
- max_zoom
- 17
- apikey
- transports
- format
- image/png
- style
- FRANCHISSEMENTS PASSAGE A NIVEAU DIFFICILE
- variant
- SECUROUTE.TE.PND
- TileMatrixSet
- PM
-
xyzservices.TileProviderGeoportailFrance.Securoute_Te_Te120
- url
- https://wxs.ign.fr/{apikey}/geoportail/wmts?REQUEST=GetTile&SERVICE=WMTS&VERSION=1.0.0&STYLE={style}&TILEMATRIXSET={TileMatrixSet}&FORMAT={format}&LAYER={variant}&TILEMATRIX={z}&TILEROW={y}&TILECOL={x}
- html_attribution
- Geoportail France
- attribution
- Geoportail France
- bounds
- [[-21.4756, -63.3725], [51.3121, 55.9259]]
- min_zoom
- 6
- max_zoom
- 17
- apikey
- transports
- format
- image/png
- style
- RESEAU ROUTIER TE120
- variant
- SECUROUTE.TE.TE120
- TileMatrixSet
- PM
-
xyzservices.TileProviderGeoportailFrance.Securoute_Te_Te72
- url
- https://wxs.ign.fr/{apikey}/geoportail/wmts?REQUEST=GetTile&SERVICE=WMTS&VERSION=1.0.0&STYLE={style}&TILEMATRIXSET={TileMatrixSet}&FORMAT={format}&LAYER={variant}&TILEMATRIX={z}&TILEROW={y}&TILECOL={x}
- html_attribution
- Geoportail France
- attribution
- Geoportail France
- bounds
- [[-21.4756, -63.3725], [51.3121, 55.9259]]
- min_zoom
- 6
- max_zoom
- 17
- apikey
- transports
- format
- image/png
- style
- RESEAU ROUTIER TE72
- variant
- SECUROUTE.TE.TE72
- TileMatrixSet
- PM
-
xyzservices.TileProviderGeoportailFrance.Securoute_Te_Te94
- url
- https://wxs.ign.fr/{apikey}/geoportail/wmts?REQUEST=GetTile&SERVICE=WMTS&VERSION=1.0.0&STYLE={style}&TILEMATRIXSET={TileMatrixSet}&FORMAT={format}&LAYER={variant}&TILEMATRIX={z}&TILEROW={y}&TILECOL={x}
- html_attribution
- Geoportail France
- attribution
- Geoportail France
- bounds
- [[-21.4756, -63.3725], [51.3121, 55.9259]]
- min_zoom
- 6
- max_zoom
- 17
- apikey
- transports
- format
- image/png
- style
- RESEAU ROUTIER TE94
- variant
- SECUROUTE.TE.TE94
- TileMatrixSet
- PM
-
xyzservices.TileProviderGeoportailFrance.Transportnetworks_Roads_Direction
- url
- https://wxs.ign.fr/{apikey}/geoportail/wmts?REQUEST=GetTile&SERVICE=WMTS&VERSION=1.0.0&STYLE={style}&TILEMATRIXSET={TileMatrixSet}&FORMAT={format}&LAYER={variant}&TILEMATRIX={z}&TILEROW={y}&TILECOL={x}
- html_attribution
- Geoportail France
- attribution
- Geoportail France
- bounds
- [[-21.4756, -63.3725], [51.3121, 55.9259]]
- min_zoom
- 15
- max_zoom
- 18
- apikey
- transports
- format
- image/png
- style
- normal
- variant
- TRANSPORTNETWORKS.ROADS.DIRECTION
- TileMatrixSet
- PM
-
xyzservices.TileProviderGeoportailFrance.Transports_Drones_Restrictions
- url
- https://wxs.ign.fr/{apikey}/geoportail/wmts?REQUEST=GetTile&SERVICE=WMTS&VERSION=1.0.0&STYLE={style}&TILEMATRIXSET={TileMatrixSet}&FORMAT={format}&LAYER={variant}&TILEMATRIX={z}&TILEROW={y}&TILECOL={x}
- html_attribution
- Geoportail France
- attribution
- Geoportail France
- bounds
- [[40.576, -9.88147], [51.4428, 11.6781]]
- min_zoom
- 3
- max_zoom
- 15
- apikey
- transports
- format
- image/png
- style
- normal
- variant
- TRANSPORTS.DRONES.RESTRICTIONS
- TileMatrixSet
- PM
-
-
xyzservices.Bunch5 items
-
xyzservices.TileProviderOneMapSG.Default
- url
- https://maps-{s}.onemap.sg/v3/{variant}/{z}/{x}/{y}.png
- variant
- Default
- min_zoom
- 11
- max_zoom
- 18
- bounds
- [[1.56073, 104.11475], [1.16, 103.502]]
- html_attribution
 New OneMap | Map data © contributors, Singapore Land Authority
- attribution
-  New OneMap | Map data (C) contributors, Singapore Land Authority
-
xyzservices.TileProviderOneMapSG.Night
- url
- https://maps-{s}.onemap.sg/v3/{variant}/{z}/{x}/{y}.png
- variant
- Night
- min_zoom
- 11
- max_zoom
- 18
- bounds
- [[1.56073, 104.11475], [1.16, 103.502]]
- html_attribution
- New OneMap | Map data © contributors, Singapore Land Authority
- attribution
-  New OneMap | Map data (C) contributors, Singapore Land Authority
-
xyzservices.TileProviderOneMapSG.Original
- url
- https://maps-{s}.onemap.sg/v3/{variant}/{z}/{x}/{y}.png
- variant
- Original
- min_zoom
- 11
- max_zoom
- 18
- bounds
- [[1.56073, 104.11475], [1.16, 103.502]]
- html_attribution
- New OneMap | Map data © contributors, Singapore Land Authority
- attribution
-  New OneMap | Map data (C) contributors, Singapore Land Authority
-
xyzservices.TileProviderOneMapSG.Grey
- url
- https://maps-{s}.onemap.sg/v3/{variant}/{z}/{x}/{y}.png
- variant
- Grey
- min_zoom
- 11
- max_zoom
- 18
- bounds
- [[1.56073, 104.11475], [1.16, 103.502]]
- html_attribution
- New OneMap | Map data © contributors, Singapore Land Authority
- attribution
-  New OneMap | Map data (C) contributors, Singapore Land Authority
-
xyzservices.TileProviderOneMapSG.LandLot
- url
- https://maps-{s}.onemap.sg/v3/{variant}/{z}/{x}/{y}.png
- variant
- LandLot
- min_zoom
- 11
- max_zoom
- 18
- bounds
- [[1.56073, 104.11475], [1.16, 103.502]]
- html_attribution
- New OneMap | Map data © contributors, Singapore Land Authority
- attribution
-  New OneMap | Map data (C) contributors, Singapore Land Authority
-
-
xyzservices.Bunch3 items
-
xyzservices.TileProviderUSGS.USTopo
- url
- https://basemap.nationalmap.gov/arcgis/rest/services/USGSTopo/MapServer/tile/{z}/{y}/{x}
- max_zoom
- 20
- html_attribution
- Tiles courtesy of the U.S. Geological Survey
- attribution
- Tiles courtesy of the U.S. Geological Survey
-
xyzservices.TileProviderUSGS.USImagery
- url
- https://basemap.nationalmap.gov/arcgis/rest/services/USGSImageryOnly/MapServer/tile/{z}/{y}/{x}
- max_zoom
- 20
- html_attribution
- Tiles courtesy of the U.S. Geological Survey
- attribution
- Tiles courtesy of the U.S. Geological Survey
-
xyzservices.TileProviderUSGS.USImageryTopo
- url
- https://basemap.nationalmap.gov/arcgis/rest/services/USGSImageryTopo/MapServer/tile/{z}/{y}/{x}
- max_zoom
- 20
- html_attribution
- Tiles courtesy of the U.S. Geological Survey
- attribution
- Tiles courtesy of the U.S. Geological Survey
-
-
xyzservices.Bunch6 items
-
xyzservices.TileProviderWaymarkedTrails.hiking
- url
- https://tile.waymarkedtrails.org/{variant}/{z}/{x}/{y}.png
- max_zoom
- 18
- html_attribution
- Map data: © OpenStreetMap contributors | Map style: © waymarkedtrails.org (CC-BY-SA)
- attribution
- Map data: (C) OpenStreetMap contributors | Map style: (C) waymarkedtrails.org (CC-BY-SA)
- variant
- hiking
-
xyzservices.TileProviderWaymarkedTrails.cycling
- url
- https://tile.waymarkedtrails.org/{variant}/{z}/{x}/{y}.png
- max_zoom
- 18
- html_attribution
- Map data: © OpenStreetMap contributors | Map style: © waymarkedtrails.org (CC-BY-SA)
- attribution
- Map data: (C) OpenStreetMap contributors | Map style: (C) waymarkedtrails.org (CC-BY-SA)
- variant
- cycling
-
xyzservices.TileProviderWaymarkedTrails.mtb
- url
- https://tile.waymarkedtrails.org/{variant}/{z}/{x}/{y}.png
- max_zoom
- 18
- html_attribution
- Map data: © OpenStreetMap contributors | Map style: © waymarkedtrails.org (CC-BY-SA)
- attribution
- Map data: (C) OpenStreetMap contributors | Map style: (C) waymarkedtrails.org (CC-BY-SA)
- variant
- mtb
-
xyzservices.TileProviderWaymarkedTrails.slopes
- url
- https://tile.waymarkedtrails.org/{variant}/{z}/{x}/{y}.png
- max_zoom
- 18
- html_attribution
- Map data: © OpenStreetMap contributors | Map style: © waymarkedtrails.org (CC-BY-SA)
- attribution
- Map data: (C) OpenStreetMap contributors | Map style: (C) waymarkedtrails.org (CC-BY-SA)
- variant
- slopes
-
xyzservices.TileProviderWaymarkedTrails.riding
- url
- https://tile.waymarkedtrails.org/{variant}/{z}/{x}/{y}.png
- max_zoom
- 18
- html_attribution
- Map data: © OpenStreetMap contributors | Map style: © waymarkedtrails.org (CC-BY-SA)
- attribution
- Map data: (C) OpenStreetMap contributors | Map style: (C) waymarkedtrails.org (CC-BY-SA)
- variant
- riding
-
xyzservices.TileProviderWaymarkedTrails.skating
- url
- https://tile.waymarkedtrails.org/{variant}/{z}/{x}/{y}.png
- max_zoom
- 18
- html_attribution
- Map data: © OpenStreetMap contributors | Map style: © waymarkedtrails.org (CC-BY-SA)
- attribution
- Map data: (C) OpenStreetMap contributors | Map style: (C) waymarkedtrails.org (CC-BY-SA)
- variant
- skating
-
-
xyzservices.TileProviderOpenAIP
- url
- https://{s}.tile.maps.openaip.net/geowebcache/service/tms/1.0.0/openaip_basemap@EPSG%3A900913@png/{z}/{x}/{y}.{ext}
- html_attribution
- openAIP Data (CC-BY-NC-SA)
- attribution
- openAIP Data (CC-BY-NC-SA)
- ext
- png
- min_zoom
- 4
- max_zoom
- 14
- tms
- True
- detectRetina
- True
- subdomains
- 12
-
xyzservices.Bunch1 items
-
xyzservices.TileProviderOpenSnowMap.pistes
- url
- https://tiles.opensnowmap.org/{variant}/{z}/{x}/{y}.png
- min_zoom
- 9
- max_zoom
- 18
- html_attribution
- Map data: © OpenStreetMap contributors & ODbL, © www.opensnowmap.org CC-BY-SA
- attribution
- Map data: (C) OpenStreetMap contributors & ODbL, (C) www.opensnowmap.org CC-BY-SA
- variant
- pistes
-
-
xyzservices.Bunch7 items
-
xyzservices.TileProviderAzureMaps.MicrosoftImagery
- url
- https://atlas.microsoft.com/map/tile?api-version={apiVersion}&tilesetId={variant}&x={x}&y={y}&zoom={z}&language={language}&subscription-key={subscriptionKey}
- html_attribution
- See https://docs.microsoft.com/en-us/rest/api/maps/render-v2/get-map-tile for details.
- attribution
- See https://docs.microsoft.com/en-us/rest/api/maps/render-v2/get-map-tile for details.
- apiVersion
- 2.0
- variant
- microsoft.imagery
- subscriptionKey
- language
- en-US
-
xyzservices.TileProviderAzureMaps.MicrosoftBaseDarkGrey
- url
- https://atlas.microsoft.com/map/tile?api-version={apiVersion}&tilesetId={variant}&x={x}&y={y}&zoom={z}&language={language}&subscription-key={subscriptionKey}
- html_attribution
- See https://docs.microsoft.com/en-us/rest/api/maps/render-v2/get-map-tile for details.
- attribution
- See https://docs.microsoft.com/en-us/rest/api/maps/render-v2/get-map-tile for details.
- apiVersion
- 2.0
- variant
- microsoft.base.darkgrey
- subscriptionKey
- language
- en-US
-
xyzservices.TileProviderAzureMaps.MicrosoftBaseRoad
- url
- https://atlas.microsoft.com/map/tile?api-version={apiVersion}&tilesetId={variant}&x={x}&y={y}&zoom={z}&language={language}&subscription-key={subscriptionKey}
- html_attribution
- See https://docs.microsoft.com/en-us/rest/api/maps/render-v2/get-map-tile for details.
- attribution
- See https://docs.microsoft.com/en-us/rest/api/maps/render-v2/get-map-tile for details.
- apiVersion
- 2.0
- variant
- microsoft.base.road
- subscriptionKey
- language
- en-US
-
xyzservices.TileProviderAzureMaps.MicrosoftBaseHybridRoad
- url
- https://atlas.microsoft.com/map/tile?api-version={apiVersion}&tilesetId={variant}&x={x}&y={y}&zoom={z}&language={language}&subscription-key={subscriptionKey}
- html_attribution
- See https://docs.microsoft.com/en-us/rest/api/maps/render-v2/get-map-tile for details.
- attribution
- See https://docs.microsoft.com/en-us/rest/api/maps/render-v2/get-map-tile for details.
- apiVersion
- 2.0
- variant
- microsoft.base.hybrid.road
- subscriptionKey
- language
- en-US
-
xyzservices.TileProviderAzureMaps.MicrosoftTerraMain
- url
- https://atlas.microsoft.com/map/tile?api-version={apiVersion}&tilesetId={variant}&x={x}&y={y}&zoom={z}&language={language}&subscription-key={subscriptionKey}
- html_attribution
- See https://docs.microsoft.com/en-us/rest/api/maps/render-v2/get-map-tile for details.
- attribution
- See https://docs.microsoft.com/en-us/rest/api/maps/render-v2/get-map-tile for details.
- apiVersion
- 2.0
- variant
- microsoft.terra.main
- subscriptionKey
- language
- en-US
-
xyzservices.TileProviderAzureMaps.MicrosoftWeatherInfraredMain
- url
- https://atlas.microsoft.com/map/tile?api-version={apiVersion}&tilesetId={variant}&x={x}&y={y}&zoom={z}&timeStamp={timeStamp}&language={language}&subscription-key={subscriptionKey}
- html_attribution
- See https://docs.microsoft.com/en-us/rest/api/maps/render-v2/get-map-tile#uri-parameters for details.
- attribution
- See https://docs.microsoft.com/en-us/rest/api/maps/render-v2/get-map-tile#uri-parameters for details.
- apiVersion
- 2.0
- variant
- microsoft.weather.infrared.main
- subscriptionKey
- language
- en-US
- timeStamp
- 2021-05-08T09:03:00Z
-
xyzservices.TileProviderAzureMaps.MicrosoftWeatherRadarMain
- url
- https://atlas.microsoft.com/map/tile?api-version={apiVersion}&tilesetId={variant}&x={x}&y={y}&zoom={z}&timeStamp={timeStamp}&language={language}&subscription-key={subscriptionKey}
- html_attribution
- See https://docs.microsoft.com/en-us/rest/api/maps/render-v2/get-map-tile#uri-parameters for details.
- attribution
- See https://docs.microsoft.com/en-us/rest/api/maps/render-v2/get-map-tile#uri-parameters for details.
- apiVersion
- 2.0
- variant
- microsoft.weather.radar.main
- subscriptionKey
- language
- en-US
- timeStamp
- 2021-05-08T09:03:00Z
-
-
xyzservices.Bunch4 items
-
xyzservices.TileProviderSwissFederalGeoportal.NationalMapColor
- url
- https://wmts.geo.admin.ch/1.0.0/ch.swisstopo.pixelkarte-farbe/default/current/3857/{z}/{x}/{y}.jpeg
- html_attribution
- swisstopo
- attribution
- © swisstopo
- bounds
- [[45.398181, 5.140242], [48.230651, 11.47757]]
- min_zoom
- 2
- max_zoom
- 18
-
xyzservices.TileProviderSwissFederalGeoportal.NationalMapGrey
- url
- https://wmts.geo.admin.ch/1.0.0/ch.swisstopo.pixelkarte-grau/default/current/3857/{z}/{x}/{y}.jpeg
- html_attribution
- swisstopo
- attribution
- © swisstopo
- bounds
- [[45.398181, 5.140242], [48.230651, 11.47757]]
- min_zoom
- 2
- max_zoom
- 18
-
xyzservices.TileProviderSwissFederalGeoportal.SWISSIMAGE
- url
- https://wmts.geo.admin.ch/1.0.0/ch.swisstopo.swissimage/default/current/3857/{z}/{x}/{y}.jpeg
- html_attribution
- swisstopo
- attribution
- © swisstopo
- bounds
- [[45.398181, 5.140242], [48.230651, 11.47757]]
- min_zoom
- 2
- max_zoom
- 19
-
xyzservices.TileProviderSwissFederalGeoportal.JourneyThroughTime
- url
- https://wmts.geo.admin.ch/1.0.0/ch.swisstopo.zeitreihen/default/{time}/3857/{z}/{x}/{y}.png
- html_attribution
- swisstopo
- attribution
- © swisstopo
- bounds
- [[45.398181, 5.140242], [48.230651, 11.47757]]
- min_zoom
- 2
- max_zoom
- 18
- time
- 18641231
-
-
xyzservices.Bunch2 items
-
xyzservices.Bunch5 items
-
xyzservices.TileProviderStrava.All
- url
- https://heatmap-external-a.strava.com/tiles/all/hot/{z}/{x}/{y}.png
- max_zoom
- 15
- attribution
- Map tiles by Strava 2021
- html_attribution
- Map tiles by Strava 2021
-
xyzservices.TileProviderStrava.Ride
- url
- https://heatmap-external-a.strava.com/tiles/ride/hot/{z}/{x}/{y}.png
- max_zoom
- 15
- attribution
- Map tiles by Strava 2021
- html_attribution
- Map tiles by Strava 2021
-
xyzservices.TileProviderStrava.Run
- url
- https://heatmap-external-a.strava.com/tiles/run/bluered/{z}/{x}/{y}.png
- max_zoom
- 15
- attribution
- Map tiles by Strava 2021
- html_attribution
- Map tiles by Strava 2021
-
xyzservices.TileProviderStrava.Water
- url
- https://heatmap-external-a.strava.com/tiles/water/blue/{z}/{x}/{y}.png
- max_zoom
- 15
- attribution
- Map tiles by Strava 2021
- html_attribution
- Map tiles by Strava 2021
-
xyzservices.TileProviderStrava.Winter
- url
- https://heatmap-external-a.strava.com/tiles/winter/hot/{z}/{x}/{y}.png
- max_zoom
- 15
- attribution
- Map tiles by Strava 2021
- html_attribution
- Map tiles by Strava 2021
-
-
xyzservices.Bunch7 items
-
xyzservices.TileProviderOrdnanceSurvey.Road
- url
- https://api.os.uk/maps/raster/v1/zxy/Road_3857/{z}/{x}/{y}.png?key={key}
- html_attribution
- Contains OS data © Crown copyright and database right 2023
- attribution
- Contains OS data (C) Crown copyright and database right 2023
- key
- min_zoom
- 7
- max_zoom
- 16
- max_zoom_premium
- 20
- bounds
- [[49.766807, -9.496386], [61.465189, 3.634745]]
-
xyzservices.TileProviderOrdnanceSurvey.Road_27700
- url
- https://api.os.uk/maps/raster/v1/zxy/Road_27700/{z}/{x}/{y}.png?key={key}
- html_attribution
- Contains OS data © Crown copyright and database right 2023
- attribution
- Contains OS data (C) Crown copyright and database right 2023
- key
- crs
- EPSG:27700
- min_zoom
- 0
- max_zoom
- 9
- max_zoom_premium
- 13
- bounds
- [[0, 0], [700000, 1300000]]
-
xyzservices.TileProviderOrdnanceSurvey.Outdoor
- url
- https://api.os.uk/maps/raster/v1/zxy/Outdoor_3857/{z}/{x}/{y}.png?key={key}
- html_attribution
- Contains OS data © Crown copyright and database right 2023
- attribution
- Contains OS data (C) Crown copyright and database right 2023
- key
- min_zoom
- 7
- max_zoom
- 16
- max_zoom_premium
- 20
- bounds
- [[49.766807, -9.496386], [61.465189, 3.634745]]
-
xyzservices.TileProviderOrdnanceSurvey.Outdoor_27700
- url
- https://api.os.uk/maps/raster/v1/zxy/Outdoor_27700/{z}/{x}/{y}.png?key={key}
- html_attribution
- Contains OS data © Crown copyright and database right 2023
- attribution
- Contains OS data (C) Crown copyright and database right 2023
- key
- crs
- EPSG:27700
- min_zoom
- 0
- max_zoom
- 9
- max_zoom_premium
- 13
- bounds
- [[0, 0], [700000, 1300000]]
-
xyzservices.TileProviderOrdnanceSurvey.Light
- url
- https://api.os.uk/maps/raster/v1/zxy/Light_3857/{z}/{x}/{y}.png?key={key}
- html_attribution
- Contains OS data © Crown copyright and database right 2023
- attribution
- Contains OS data (C) Crown copyright and database right 2023
- key
- min_zoom
- 7
- max_zoom
- 16
- max_zoom_premium
- 20
- bounds
- [[49.766807, -9.496386], [61.465189, 3.634745]]
-
xyzservices.TileProviderOrdnanceSurvey.Light_27700
- url
- https://api.os.uk/maps/raster/v1/zxy/Light_27700/{z}/{x}/{y}.png?key={key}
- html_attribution
- Contains OS data © Crown copyright and database right 2023
- attribution
- Contains OS data (C) Crown copyright and database right 2023
- key
- crs
- EPSG:27700
- min_zoom
- 0
- max_zoom
- 9
- max_zoom_premium
- 13
- bounds
- [[0, 0], [700000, 1300000]]
-
xyzservices.TileProviderOrdnanceSurvey.Leisure_27700
- url
- https://api.os.uk/maps/raster/v1/zxy/Leisure_27700/{z}/{x}/{y}.png?key={key}
- html_attribution
- Contains OS data © Crown copyright and database right 2023
- attribution
- Contains OS data (C) Crown copyright and database right 2023
- key
- crs
- EPSG:27700
- min_zoom
- 0
- max_zoom
- 5
- max_zoom_premium
- 9
- bounds
- [[0, 0], [700000, 1300000]]
-
-
xyzservices.Bunch12 items
-
xyzservices.TileProviderStamen.Toner
- url
- https://stamen-tiles-{s}.a.ssl.fastly.net/{variant}/{z}/{x}/{y}{r}.{ext}
- html_attribution
- Map tiles by Stamen Design, CC BY 3.0 — Map data © OpenStreetMap contributors
- attribution
- Map tiles by Stamen Design, CC BY 3.0 -- Map data (C) OpenStreetMap contributors
- subdomains
- abcd
- min_zoom
- 0
- max_zoom
- 20
- variant
- toner
- ext
- png
-
xyzservices.TileProviderStamen.TonerBackground
- url
- https://stamen-tiles-{s}.a.ssl.fastly.net/{variant}/{z}/{x}/{y}{r}.{ext}
- html_attribution
- Map tiles by Stamen Design, CC BY 3.0 — Map data © OpenStreetMap contributors
- attribution
- Map tiles by Stamen Design, CC BY 3.0 -- Map data (C) OpenStreetMap contributors
- subdomains
- abcd
- min_zoom
- 0
- max_zoom
- 20
- variant
- toner-background
- ext
- png
-
xyzservices.TileProviderStamen.TonerHybrid
- url
- https://stamen-tiles-{s}.a.ssl.fastly.net/{variant}/{z}/{x}/{y}{r}.{ext}
- html_attribution
- Map tiles by Stamen Design, CC BY 3.0 — Map data © OpenStreetMap contributors
- attribution
- Map tiles by Stamen Design, CC BY 3.0 -- Map data (C) OpenStreetMap contributors
- subdomains
- abcd
- min_zoom
- 0
- max_zoom
- 20
- variant
- toner-hybrid
- ext
- png
-
xyzservices.TileProviderStamen.TonerLines
- url
- https://stamen-tiles-{s}.a.ssl.fastly.net/{variant}/{z}/{x}/{y}{r}.{ext}
- html_attribution
- Map tiles by Stamen Design, CC BY 3.0 — Map data © OpenStreetMap contributors
- attribution
- Map tiles by Stamen Design, CC BY 3.0 -- Map data (C) OpenStreetMap contributors
- subdomains
- abcd
- min_zoom
- 0
- max_zoom
- 20
- variant
- toner-lines
- ext
- png
-
xyzservices.TileProviderStamen.TonerLabels
- url
- https://stamen-tiles-{s}.a.ssl.fastly.net/{variant}/{z}/{x}/{y}{r}.{ext}
- html_attribution
- Map tiles by Stamen Design, CC BY 3.0 — Map data © OpenStreetMap contributors
- attribution
- Map tiles by Stamen Design, CC BY 3.0 -- Map data (C) OpenStreetMap contributors
- subdomains
- abcd
- min_zoom
- 0
- max_zoom
- 20
- variant
- toner-labels
- ext
- png
-
xyzservices.TileProviderStamen.TonerLite
- url
- https://stamen-tiles-{s}.a.ssl.fastly.net/{variant}/{z}/{x}/{y}{r}.{ext}
- html_attribution
- Map tiles by Stamen Design, CC BY 3.0 — Map data © OpenStreetMap contributors
- attribution
- Map tiles by Stamen Design, CC BY 3.0 -- Map data (C) OpenStreetMap contributors
- subdomains
- abcd
- min_zoom
- 0
- max_zoom
- 20
- variant
- toner-lite
- ext
- png
-
xyzservices.TileProviderStamen.Watercolor
- url
- https://stamen-tiles-{s}.a.ssl.fastly.net/{variant}/{z}/{x}/{y}.{ext}
- html_attribution
- Map tiles by Stamen Design, CC BY 3.0 — Map data © OpenStreetMap contributors
- attribution
- Map tiles by Stamen Design, CC BY 3.0 -- Map data (C) OpenStreetMap contributors
- subdomains
- abcd
- min_zoom
- 1
- max_zoom
- 16
- variant
- watercolor
- ext
- jpg
-
xyzservices.TileProviderStamen.Terrain
- url
- https://stamen-tiles-{s}.a.ssl.fastly.net/{variant}/{z}/{x}/{y}{r}.{ext}
- html_attribution
- Map tiles by Stamen Design, CC BY 3.0 — Map data © OpenStreetMap contributors
- attribution
- Map tiles by Stamen Design, CC BY 3.0 -- Map data (C) OpenStreetMap contributors
- subdomains
- abcd
- min_zoom
- 0
- max_zoom
- 18
- variant
- terrain
- ext
- png
-
xyzservices.TileProviderStamen.TerrainBackground
- url
- https://stamen-tiles-{s}.a.ssl.fastly.net/{variant}/{z}/{x}/{y}{r}.{ext}
- html_attribution
- Map tiles by Stamen Design, CC BY 3.0 — Map data © OpenStreetMap contributors
- attribution
- Map tiles by Stamen Design, CC BY 3.0 -- Map data (C) OpenStreetMap contributors
- subdomains
- abcd
- min_zoom
- 0
- max_zoom
- 18
- variant
- terrain-background
- ext
- png
-
xyzservices.TileProviderStamen.TerrainLabels
- url
- https://stamen-tiles-{s}.a.ssl.fastly.net/{variant}/{z}/{x}/{y}{r}.{ext}
- html_attribution
- Map tiles by Stamen Design, CC BY 3.0 — Map data © OpenStreetMap contributors
- attribution
- Map tiles by Stamen Design, CC BY 3.0 -- Map data (C) OpenStreetMap contributors
- subdomains
- abcd
- min_zoom
- 0
- max_zoom
- 18
- variant
- terrain-labels
- ext
- png
-
xyzservices.TileProviderStamen.TopOSMRelief
- url
- https://stamen-tiles-{s}.a.ssl.fastly.net/{variant}/{z}/{x}/{y}.{ext}
- html_attribution
- Map tiles by Stamen Design, CC BY 3.0 — Map data © OpenStreetMap contributors
- attribution
- Map tiles by Stamen Design, CC BY 3.0 -- Map data (C) OpenStreetMap contributors
- subdomains
- abcd
- min_zoom
- 0
- max_zoom
- 20
- variant
- toposm-color-relief
- ext
- jpg
- bounds
- [[22, -132], [51, -56]]
-
xyzservices.TileProviderStamen.TopOSMFeatures
- url
- https://stamen-tiles-{s}.a.ssl.fastly.net/{variant}/{z}/{x}/{y}{r}.{ext}
- html_attribution
- Map tiles by Stamen Design, CC BY 3.0 — Map data © OpenStreetMap contributors
- attribution
- Map tiles by Stamen Design, CC BY 3.0 -- Map data (C) OpenStreetMap contributors
- subdomains
- abcd
- min_zoom
- 0
- max_zoom
- 20
- variant
- toposm-features
- ext
- png
- bounds
- [[22, -132], [51, -56]]
- opacity
- 0.9
-
Most of those providers have themselves multiple options. For example, OpenStreetMap provides multiple background styles:
[8]:
cx.providers.OpenStreetMap
[8]:
-
xyzservices.TileProviderOpenStreetMap.Mapnik
- url
- https://tile.openstreetmap.org/{z}/{x}/{y}.png
- max_zoom
- 19
- html_attribution
- © OpenStreetMap contributors
- attribution
- (C) OpenStreetMap contributors
-
xyzservices.TileProviderOpenStreetMap.DE
- url
- https://tile.openstreetmap.de/{z}/{x}/{y}.png
- max_zoom
- 18
- html_attribution
- © OpenStreetMap contributors
- attribution
- (C) OpenStreetMap contributors
-
xyzservices.TileProviderOpenStreetMap.CH
- url
- https://tile.osm.ch/switzerland/{z}/{x}/{y}.png
- max_zoom
- 18
- html_attribution
- © OpenStreetMap contributors
- attribution
- (C) OpenStreetMap contributors
- bounds
- [[45, 5], [48, 11]]
-
xyzservices.TileProviderOpenStreetMap.France
- url
- https://{s}.tile.openstreetmap.fr/osmfr/{z}/{x}/{y}.png
- max_zoom
- 20
- html_attribution
- © OpenStreetMap France | © OpenStreetMap contributors
- attribution
- (C) OpenStreetMap France | (C) OpenStreetMap contributors
-
xyzservices.TileProviderOpenStreetMap.HOT
- url
- https://{s}.tile.openstreetmap.fr/hot/{z}/{x}/{y}.png
- max_zoom
- 19
- html_attribution
- © OpenStreetMap contributors, Tiles style by Humanitarian OpenStreetMap Team hosted by OpenStreetMap France
- attribution
- (C) OpenStreetMap contributors, Tiles style by Humanitarian OpenStreetMap Team hosted by OpenStreetMap France
-
xyzservices.TileProviderOpenStreetMap.BZH
- url
- https://tile.openstreetmap.bzh/br/{z}/{x}/{y}.png
- max_zoom
- 19
- html_attribution
- © OpenStreetMap contributors, Tiles courtesy of Breton OpenStreetMap Team
- attribution
- (C) OpenStreetMap contributors, Tiles courtesy of Breton OpenStreetMap Team
- bounds
- [[46.2, -5.5], [50, 0.7]]
-
xyzservices.TileProviderOpenStreetMap.BlackAndWhite
- url
- http://{s}.tiles.wmflabs.org/bw-mapnik/{z}/{x}/{y}.png
- max_zoom
- 18
- attribution
- (C) OpenStreetMap contributors
- html_attribution
- © OpenStreetMap contributors
Looking at a single one of those options, for example “Mapnik” (the default OpenStreetMap background), we can see this is a TileProvider object, which behaves as a dict:
[9]:
type(cx.providers.OpenStreetMap.Mapnik)
[9]:
xyzservices.lib.TileProvider
We can explore its contents:
[10]:
cx.providers.OpenStreetMap.Mapnik
[10]:
- url
- https://tile.openstreetmap.org/{z}/{x}/{y}.png
- max_zoom
- 19
- html_attribution
- © OpenStreetMap contributors
- attribution
- (C) OpenStreetMap contributors
A “provider object” is then a dictionary with a few required entries, such as the url (required, with {z}/{x}/{y} to be replaced), with some additional metadata information (optional). These can be the attribution text to be used on the plot (attribution), or the maximum zoom level available for these tiles (max_zoom). When this information is available, contextily is smart enough to access and use it automatically.
Specifying options for a provider#
Some providers require additional information, such as an API access key. This can be specified by calling the provider object. Any keyword specified will override the default value in the provider object.
For example, the OpenWeatherMap requires an API key:
[11]:
cx.providers.OpenWeatherMap.Clouds
[11]:
- url
- http://{s}.tile.openweathermap.org/map/{variant}/{z}/{x}/{y}.png?appid={apiKey}
- max_zoom
- 19
- html_attribution
- Map data © OpenWeatherMap
- attribution
- Map data (C) OpenWeatherMap
- apiKey
- opacity
- 0.5
- variant
- clouds
We can specify this API key by calling the object:
[12]:
cx.providers.OpenWeatherMap.Clouds(apiKey="my-private-api-key")
[12]:
- url
- http://{s}.tile.openweathermap.org/map/{variant}/{z}/{x}/{y}.png?appid={apiKey}
- max_zoom
- 19
- html_attribution
- Map data © OpenWeatherMap
- attribution
- Map data (C) OpenWeatherMap
- apiKey
- my-private-api-key
- opacity
- 0.5
- variant
- clouds
This can then be specified where a source is expected. For example:
cx.add_basemap(ax, source=cx.providers.OpenWeatherMap.Clouds(apiKey="my-private-api-key"))
Manually specifying a provider#
Since the provider definition is basically nothing more than an url with the {z}/{x}/{y} format, you can also specify such an url manually, in case the provider of your choice is not available in contextily (the provider is expected to follow the standard XYZ tile protocol):
[13]:
fig, ax = plt.subplots(figsize=(8, 8))
ax.axis(extent)
# using the url from `cx.providers.OpenStreetMap.HOT` as example
cx.add_basemap(ax, source='https://a.tile.openstreetmap.fr/hot/{z}/{x}/{y}.png')
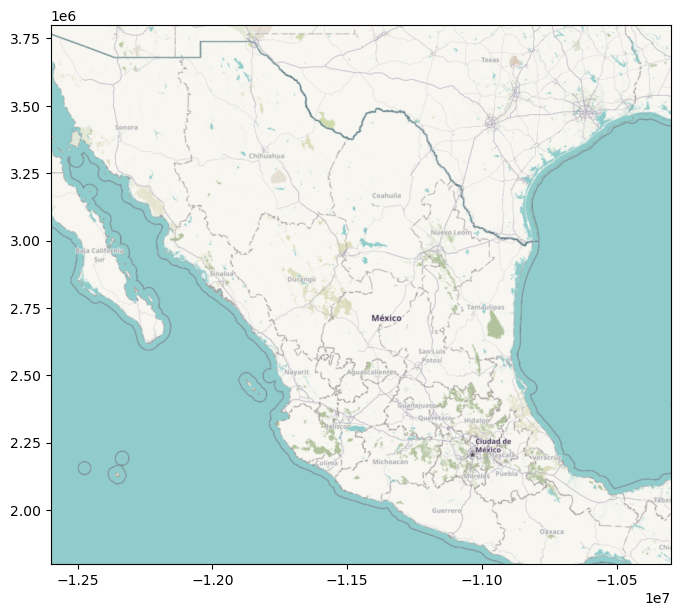
In addition, you could also construct a dictionary with the "url" key and additional information yourself, for example to provide a default attribution text for all your plots.
Overview of built-in providers#
Let us create a flat dictionary of the built-in providers:
[14]:
providers = cx.providers.flatten()
This results in quite a few of them already available:
[15]:
len(providers)
[15]:
524
For this illustration, let’s single out the following ones:
[28]:
selection = ['OpenStreetMap.Mapnik',
             'OpenStreetMap.HOT',
             'OpenTopoMap',
             'CartoDB.Positron',
             'CartoDB.Voyager',
             'CartoDB.DarkMatter',
             'NASAGIBS.ASTER_GDEM_Greyscale_Shaded_Relief',
             'NASAGIBS.ViirsEarthAtNight2012',
             'NASAGIBS.BlueMarble',
             'USGS.USTopo'
            ]
[29]:
fig, axs = plt.subplots(2, 5, figsize=(25, 10))
axs = axs.flatten()
for name, ax in zip(selection, axs):
    ax.axis(extent)
    cx.add_basemap(ax, source=providers[name])
    ax.set_title(name)
    ax.set_axis_off()
plt.show()
fig.savefig("tiles.png", bbox_inches="tight")
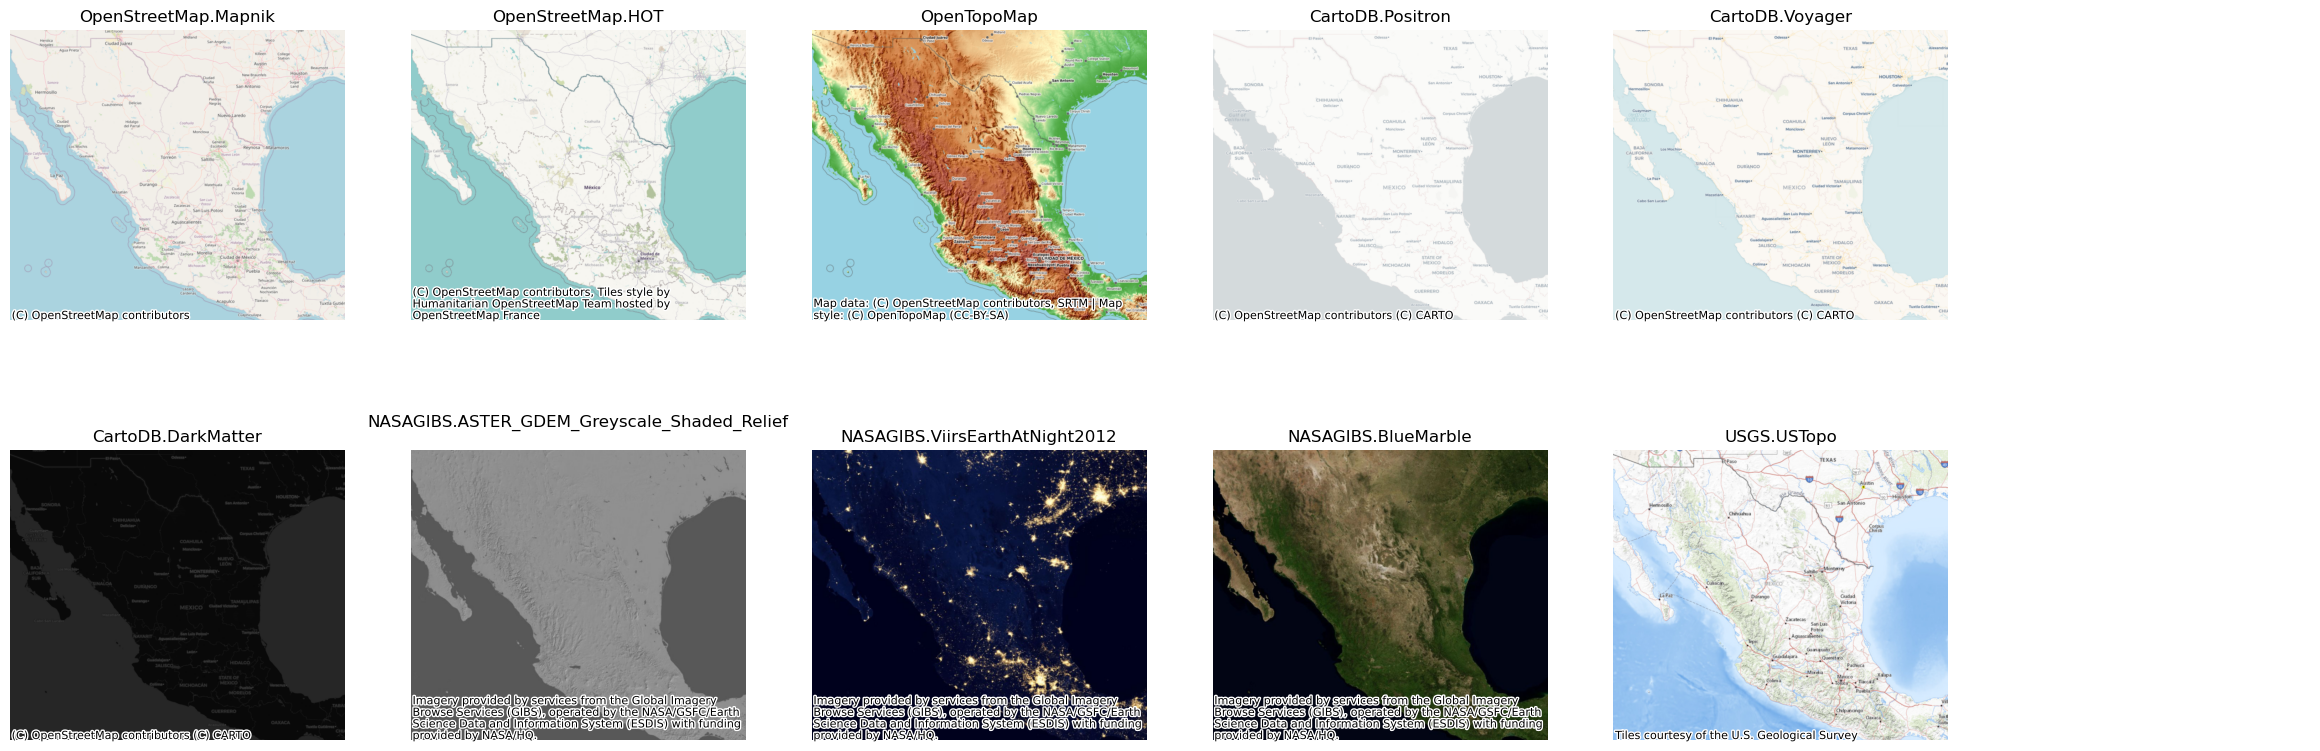
For more details on providers, see the documentation of `xyzservices <https://xyzservices.readthedocs.io/en/stable/index.html>`__.